Recently many people in the crypto space have been talking about the China crackdown on crypto mining and consequent drop in the Bitcoin hashrate. But what is it exactly? In the first part of this article we explore in detail what is the Bitcoin hashrate, and present an analysis of data related to it to discuss its main characteristics and evolution over time. In the second part, we focus on the impact of the Bitcoin hashrate on the profitability of a crypto mining operations, and why miners should pay close attention to it and possibly hedge the hashrate risk with customized contracts or through an experienced crypto asset manager. The final sections concludes with key takeaways.
Bitcoin hashrate refers to the number of hashes computed by all the miners in the Bitcoin network over a period of time and it is measured in number of hashes per second.
In order to process the transactions on the Bitcoin blockchain, miners on the network need to perform a huge amount of calculations to validate a particular block. These calculations consist in computing hashes on a block’s header, and if that is correct, the first miner to do will receive a specified amount of Bitcoin. This is an award created to incentivize miners to invest capital in the mining operation and cover their fixed and operational costs.
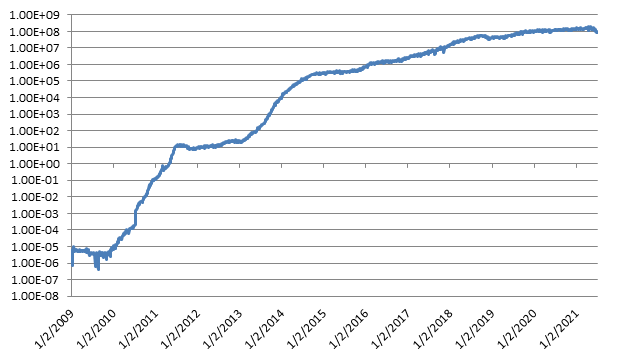
Figure 1 shows the Bitcoin hashrate over time since 2009. As we can see from it, the hashrate exhibited positive but declining growth rate over the years. This may be due to an increase in the number of professional competitors diminishing the profit revenues for each single miner and making mining a less profitable business. Another main reason could be due to the process of Bitcoin halving, discussed in more detail later in this article, where the amount of Bitcoin given to miners as an award for validating the transactions on the blockchain reduces by half approximately every 4 years.
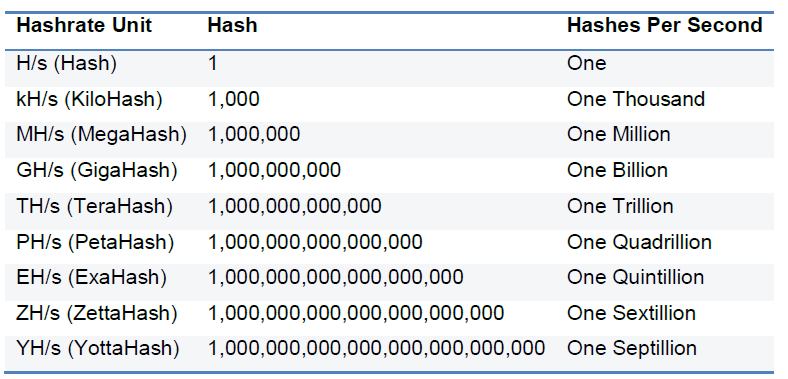
The Bitcoin hashrate is measured in hashes per second (H/s). The current Bitcoin hashrate is about 93 EH/s, where 1 EH is 1018 hashes. Its order of magnitude depends on the number miners in the network and capacity of each one. Table 1 below reports some hashrate units relevant to the hashrate measure.
In order to determine if a hash guessed by a miner is correct, he must check if its value is lower than a positive number called nonce. The nonce represents the difficulty on the network on validating a block. If the nonce is high, it will be easier and more likely to find a lower number than it, while if it is lower the opposite will happen.
The difficulty is adjusted every 2016 blocks (every 2 weeks approximately) so that the average time between each block remains around 10 minutes.
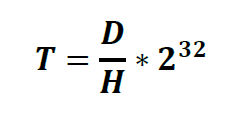
The number of Bitcoins given to miners must be approximately constant over a period of time, and the number of miners is an exogenous variable that is not controllable since anybody can participate in crypto mining anywhere in the world with no restrictions. Therefore, the Bitcoin network automatically adjusts its difficulty to guess the correct hash by changing the nonce. This is done over a number of blocks so that the network can identify a permanent change in the number of miners. The entire process can be exemplified by the following formula:
Where:
T = time to process 1 block on the Bitcoin network (approximately 10 minutes on average)
D = difficulty of the network
H = hashrate,
The hashrate is proportional to the number of miners in the network and the processing power of each miner. As we can see from the previous formula, the higher the network hashrate, the higher will be the difficulty to keep the average processing time constant.
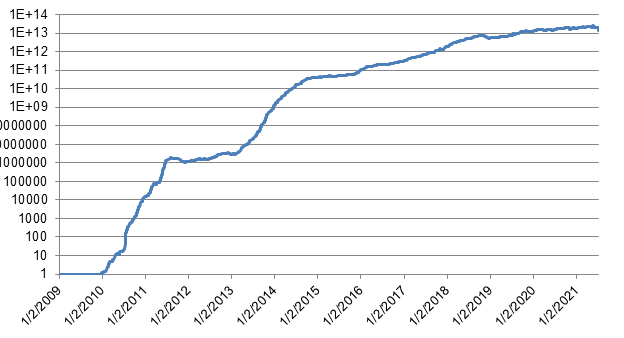
Figure 2 shows the Bitcoin network difficulty over time. As expected from the previous formula, it proportional to the network hashrate, with a correlation ratio of 0.99. This is done to keep the average verification time constant.
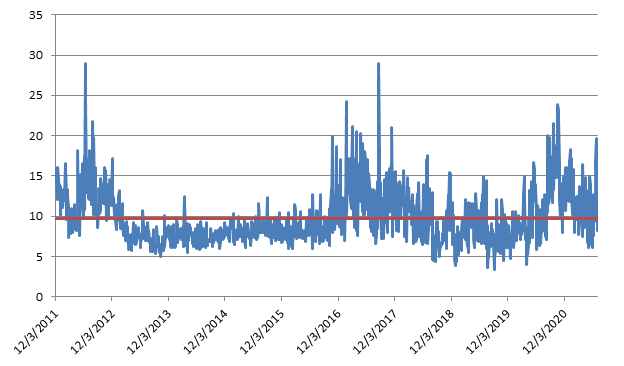
Figure 3 shows the median time to process one block on the Bitcoin blockchain. As we can see from it, the long-term average is about 10 minutes, as expected. We also notice that there are periods of time where the processing time is significantly longer. This is due to a combination of multiple factors, among which the level of congestion in the network due to an increase in the number of requests to be processed, reduced hashrate because some miners may be leaving the network and a difficulty that still hasn’t adjusted to take that into account.
In particular, this explains the temporary increase in processing time in the Bitcoin network and corresponding decrease in difficulty after the recent crackdown on Bitcoin mining in China. This in fact caused a reduction of around 50% of the network hashrate, with corresponding change in the previous numbers.
A higher hashrate should improve the security of the blockchain. Assuming in fact that each miner has a limited amount of capital that he can invest into its mining operation, the hashrate is therefore proportional to the number of miners. Assuming also that these miners operate without collusion, the chances of a 51% attack where one miner can control the blockchain network and reverse the transactions will be lower.
Bitcoin halving is mechanism built in the Bitcoin blockchain network which automatically reduces the Bitcoin reward given to miners to keep the supply of Bitcoin limited. In particular, halving as the names suggests reduces by half the reward every 210,000 blocks, which occurs approximately every 4 years.
Bitcoin halving it’s very important for miners because it directly impacts their revenues. In fact, each time that a Bitcoin halving happens, their revenues in Bitcoin terms is effectively cut in half. Theoretically since the supply of Bitcoin will reduce, the price of Bitcoin in USD terms should go up assuming constant demand, keeping the mining revenues in USD around the same. We can see if that has been the case over the past years.
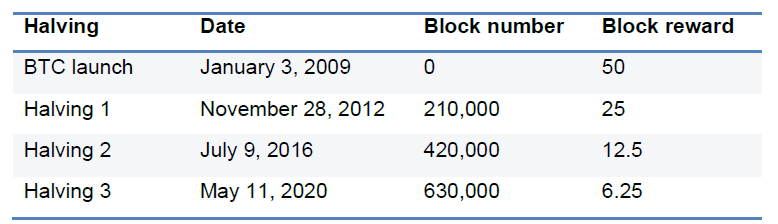
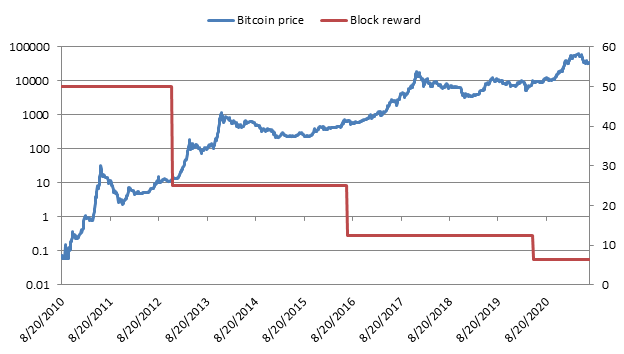
Table 2 shows the history of the Bitcoin halving dates happened so far, while Figure 4 shows the Bitcoin block rewards together with the corresponding Bitcoin price. As we can see from it, it seems that there is an increase in price in Bitcoin every time there is a halving. This is consistent with what we predicted before due to the reduction in the supply of Bitcoin and the amount that miners can sell in the market.
Having previously discussed the Bitcoin hashrate we now turn our analysis on how it matters for miners. We have seen that the hashrate is a measure of the amount of competition among miners, since the total amount of Bitcoin produced in a given period of time is kept approximately constant endogenously by the blockchain algorithms.
We can decompose the net profit of a Bitcoin mining company into revenues and costs. For our current discussion, we assume that the miner wants to maximize its profitability in USD, since he will have to pay fixed and recurring expenses in fiat currency. Accordingly, we have the following:
Where:
π(t) = profit of the Bitcoin mining operation in USD
R(t) = revenues of the Bitcoin mining operation in USD
C(t) = total cost of the Bitcoin mining operation in USD
In the next sections we analyze each component in more detail, with the corresponding risk for the miner, and determine the optimal hedging strategy.
Bitcoin annual mining revenues in USD are determined by the amount of Bitcoin earned over the year, multiplied by the price of Bitcoin. Assuming that the miner earns a constant amount of Bitcoin each day, and that he sells or hedge immediately them as soon as they are earned, we have the following relationship:
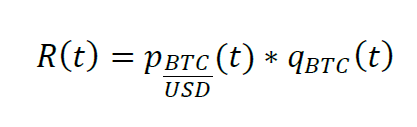
Where:
Rt) = Bitcoin miner revenue on day t in USD
p(t) = BTC/USD exchange rate on day t
q(t) = quantity of Bitcoin earned by the miner on day t
In addition, the quantity earned by the miner is proportional to how powerful is mining rig is, and the total amount of mining competition in the Bitcoin network. This can be expressed as:
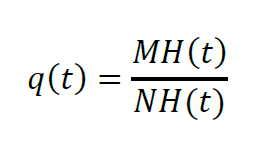
Where:
MH(t) = miner hashrate
NH(t) = Bitcoin network hashrate
Combining the previous terms, we have the following expression giving the revenues of a Bitcoin miner on a given day:
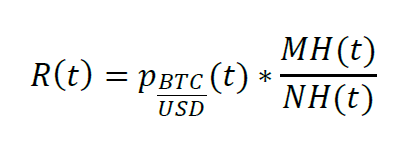
As we can see from it, Bitcoin miner revenues on a given day depend on 2 main exogenous variables, the price of Bitcoin and the total network hashrate. In order to minimize the revenue risk in USD terms, it is important to understand the amount of risk present in the previous factors, how much the miner is willing to tolerate, and the best hedging program to minimize them.
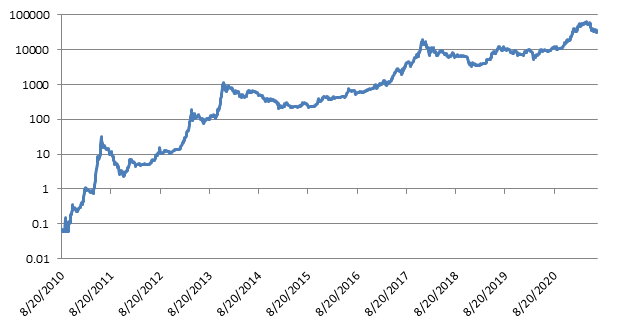
Figure 5 shows the price of Bitcoin since 2010. As we can see from it, Bitcoin is very volatile, with an average volatility of around 150%. Leaving a Bitcoin earning unhedged in USD terms it would therefore be too much even for the most risk tolerant miner. It is in fact so risky that he may even not be able to pay its variable costs denominated in USD terms or other fiat currency. It is therefore important that the Bitcoin miner devises a customized hedging strategy with a professional crypto asset manager to reduce its revenue risk due to the price of Bitcoin.
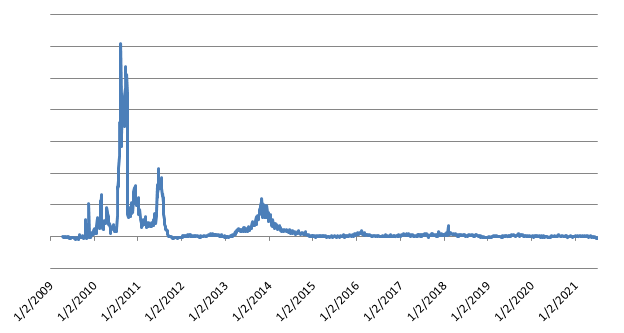
Figure 6 shows the historical monthly growth of the Bitcoin network hashrate since inception. As we can see from it, it has been growing steadily in the past, at a median rate of 37% per month. This indicates a constant increase in the mining competition and a consequent reduction in the quantity of Bitcoin earned by an individual miner assuming no increase in its mining capacity.
In terms of risk on the miner profitability, the hashrate risk is minor to the price one as being more stable and predictable, but it still accounts for a considerable portion of the Bitcoin miner revenue. This could have negative effects for the mining profitability and success in the long-run. Therefore a proper hashrate hedging program minimizing its risk needs to be devised.
There are currently 3 main ways to reduce the hashrate revenue risk for a miner:
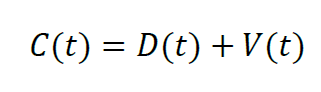
After analyzing the Bitcoin miner revenues, we now turn our attention to the other side of the equation, or the costs. Mining costs can be broken down into the depreciation cost of the initial fixed capital investment, and variable operational costs to keep the mining operation running. In other words, we have the following:
Where:
C(t) = total Bitcoin mining cost in period t
D(t) = depreciation cost mining equipment in period t
V(t) = variable operational mining expenses in period t
The previous 2 costs are contrasting, since an initial investment in higher capacity and modern equipment will most likely result in lower energy consumption. Assuming that the it is optimal for the miner to buy the latest mining technology available on the market because of the gain in efficiency and reliability it can provide, the main focus will then be on the variable running costs.
Bitcoin mining rigs are made by ASIC equipment that is optimized for computing hashing operations very quickly and efficiently specifically for Bitcoin. They work by consuming electricity and producing heat and hashes outputs. Their capacity is given by their hashrate and is measured in hashes per seconds. A current Bitcoin ASIC miner has a hashrate of about H/s.
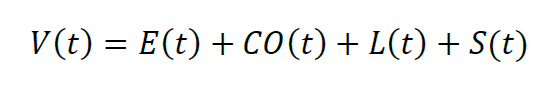
When considering the running costs of operating these miners, the main factors we need to consider are the electricity, cooling, labor, and storage costs. This is summarized as follows:
Where:
V(t) = total variable costs at time t
E(t) = electricity costs at time t
CO(t) = cooling costs at time t
L(t) = labor costs at time t
S(t) = storage costs at time t
Of the previous costs, electricity is typically the highest and most important one, since this equipment constantly consumes a lot of it to run 24/7. It is also important to note that all of the variable mining costs depend on the location of the Bitcoin mining operation. It is therefore important to perform a thorough initial business plan and feasibility analysis to make sure that the miner will select the optimal location globally depending on its specific constrain.
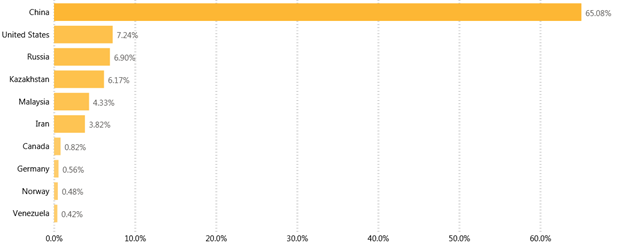
Figure 7 shows the distribution of the Bitcoin network hashrate around the world as of Q2 of 2020. As we can see from it and as reflected by recent data in hashrate drop of about 50%, most of the mining facilities were operating in China, followed by the United States and Russia.
This is mostly likely due to the previous considerations in terms of operational costs, technological advances, and a general interest in the crypto space in the previous countries. Following the recent China crackdown on mining from regulators, we expect that the US will occupy a much bigger share of mining operations for the reasons previously considered.
Having understood that electricity is the most relevant variable cost in a Bitcoin mining operation, it is now important to see its volatility and if a miner can reduce the risk in his profits by hedging it. For simplicity and availability of public data, we will use the United States as the place of reference.
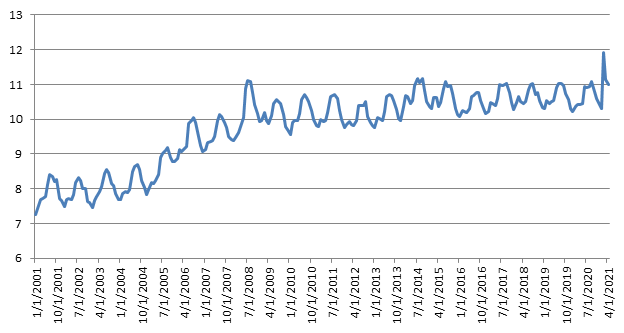
Figure 8 shows the commercial price of electricity over time in the US since 2001. As the figure shows, there is some slight upward constant trend and a seasonality component over the course of the year. Based on the previous data, electricity prices seem quite stable over the course of the year, and it is therefore not necessary for a miner to hedge them. The most important decision remains then at the beginning to locate the most optimal region providing the lowest operating variable costs, including electricity.
Having analyzed both the revenues and the costs in depth, we can conclude the following:
By A Paris – Alternative data and data science techniques can help give hedge funds a competitive edge but, it is the symbiotic integration of human and machine which ultimately underpins managers’ success or failure in their use of these techniques.
“We believe we understand these manager datasets better than anybody else and because of this we’re able to come up with factors and signals that nobody else would be able to identify; or rather it would considerably difficult for them to do so,” asserts Michael Perlow, co-founder of Epsilon Asset Management.
B. G., Opalesque Geneva: In the midst of the current market turmoil, this is the second of our regular reports on hedge fund managers who bucked the trend.
Contrarian and uncorrelated
R. G. Niederhoffer Capital Management’s flagship fund, the Diversified Program, returned +0.4% March and +25% YTD. It is a systematic, short-term trading strategy launched in 1993. The program claims a consistent negative correlation to equities and funds of hedge funds and low correlation to CTAs. It has a contrarian bias, combining core mean-reversions themes with momentum strategies. It is very liquid and highly diversified. The New York-based firm calls it a “rare true alpha strategy”. Since September 1995, it has annualised almost 5% with a volatility of 19%.
“One sec. $10270.”
Two minutes later: “Sorry guys, that was an old order from Friday when skype wasn’t working.”
“I really think we should get off skype. Bad things could happen. Someone is going to make an expensive mistake.”
A messaging exchange over a potential $1 million deal, between a European asset manager looking to sell bitcoin and broker Joel Fruhman, illustrates the casual and often chaotic nature of cryptocurrency dealmaking.
Investors always prefer financial assets with high liquidity and reflective of the real trading conditions, with no wash trading or market manipulation. However, sometimes the public data may not be trustful, like in the case of crypto markets. In this research article, we analyzed historical volume data of a highly popular cryptocurrency exchange and evaluated to what extent the reported volume reflects the real one.
In our previous article 3 Major Benefits of Crypto Liquidity Provision on Price, Volume and Volatility, we analyzed the market liquidity from three different aspects and how investors could benefit from high liquid market. Similarly, exchanges with high liquidity would be more appealing to investors, which enable them to charge more for listing fees. That’s why some cryptocurrency platforms or tokens inflated their trading volumes. In this report, we analyzed the trading volume reported by an exchange.
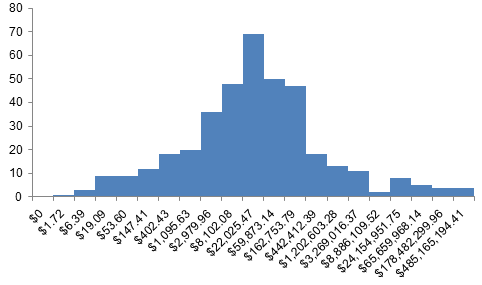
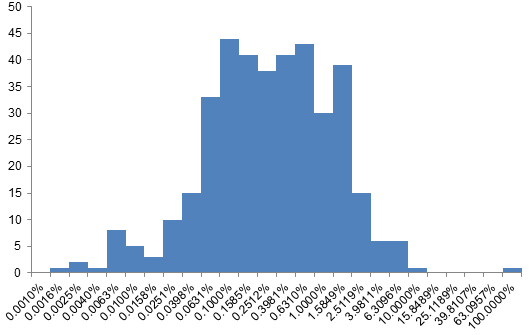
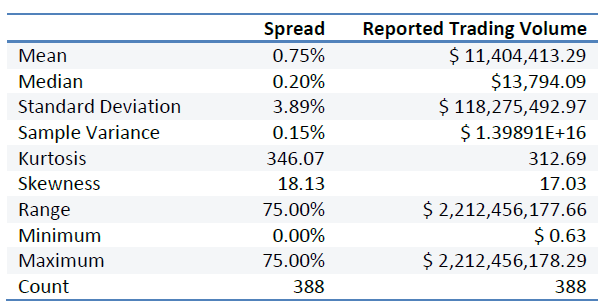
Figure 1 shows the reported trading volume of trading pairs listed on an exchange platform. After log transformation, the distribution of trading volume is close to a normal distribution, with a peak at 10, which is around $30,000. Figure 2 shows the distribution of spread, which is concentrated at the range -320% to -160%. Those are the data reported by exchanges. Table 1 summarizes some basic statistics of spread and the reported trading volumes of trading pairs we analyzed in this report. The average spread is 0.75% with a standard deviation of 3.89%. The small spread indicates high liquidity of the market and low trading costs. Unlike spread, trading volume is more spread, with volume from 0.63 to 2.2 billion. However, if we only use spread and trading volume as criterion of liquid markets, we would probably pick the wrong markets.
In the previous section we mentioned why some exchanges or tokens have incentives to fake their trading volume. In this section, we will analyze the truth under the veil. Before dive into the analysis, we need to understand how traders manipulate the trading volume through wash trading. Wash trading refers to a practice in which an investor places sell and buy orders on the same asset simultaneously in order to generate misleading information of a market such as a high liquidity or a high demand of the asset.
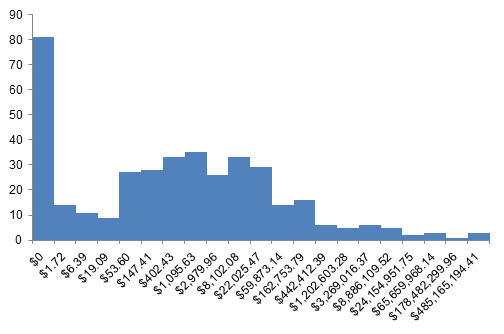
Figure 3 shows the distribution of real trading volume, which is completely different from the distribution of the reported trading volume showed in Figure 1. While the reported trading volume concentrated at range 8 to 13, the real trading volume peaked at range 0 to 1. Figure 4 shows the percentage of real trading volume in the reported trading volume. For most cases, only up to 5% of the trading volume reported is based on real trades.
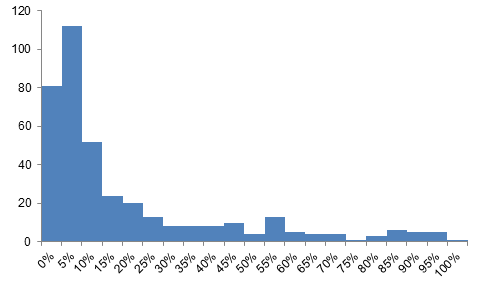
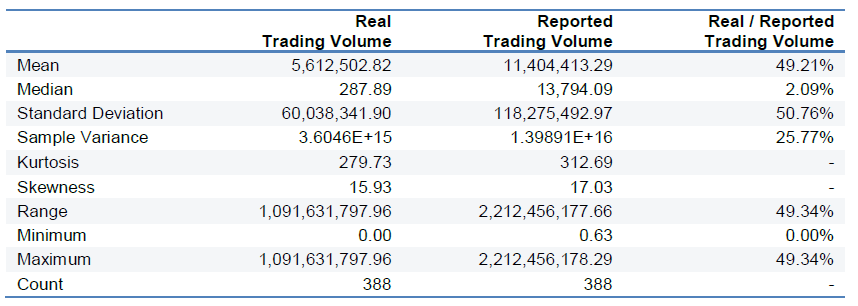
Table 2 shows the statistics of real trading volume and the reported trading volume. The huge difference between those two volumes could also be detected from their statistics. For example, the averages of the real and the reported trading volume are not even at the same magnitude.
Such difference also exists while analyzing trading pairs based on trading type. Figure 5 shows the spread vs. trading volume for different types of trades. Again, we could see that the real trading volume (in blue) has a smaller intercept than the intercept of the reported trading volume line (in red), indicating that real trading volume is much smaller than the trading volume reported by exchange platforms. Moreover, the real trading volume tends to be more sensitive to the spread than the total volume does, with a higher absolute value of slope.
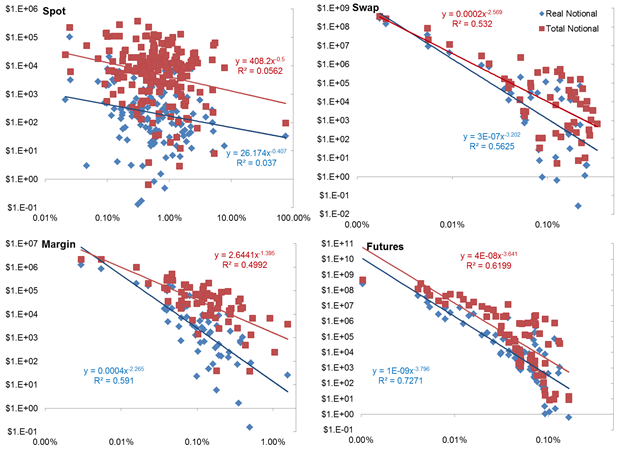
Table 3 shows the regression models of regressing spread on the real and the reported trading volumes. Except for spot, the regression models based on the real trading volume data have better performances than models based on the reported trading volume, with higher R square. For spot, the small sample size could be a reason for the R square being slightly lower than that of the model using the reported trading volume data. As the reported trading volume includes plenty of fake trades, we would expect a weak relationship between spread and the reported trading volume and that’s what the results we got as well.
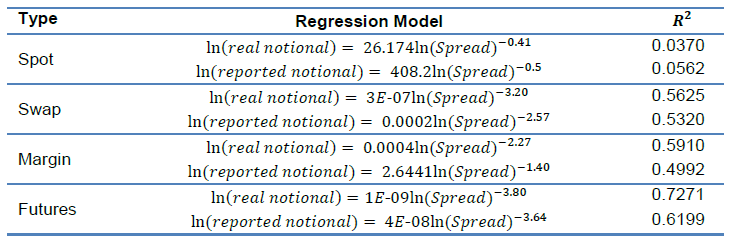
The previous results highlight the following key insights:
Investors today are facing many challenges in financial markets. Bitcoin, as one of the new investment assets, received increasing attention. This research paper analyzes the performance of Bitcoin from 2013 until today, with a special focus on its performance during the pandemic. We found that including Bitcoin in a portfolio would reward investors with higher risk-adjusted returns, because of the low correlations of Bitcoin with other financial asset classes.
The paper is structured as follows. The first section analyzes the performance of Bitcoin and other financial assets from 2013 through 2020, with a focus on the correlations across financial assets. The second section compares the performance of 60/40 portfolios with different sizes of allocations to Bitcoin. Taking 60/40 portfolio with and without Bitcoin allocation as examples, section three discusses the impact of Bitcoin on efficient frontier. The last section concludes with key takeaways.
As a fintech innovation, crypto asset values are increasing exponentially. Invented in 2008, Bitcoin now has a market capitalization at $117.81B. Would investors benefit from adding crypto assets into their investment portfolios? What would be a meaningful allocation? In this report, we will analyze and compare the performance of traditional 60/40 portfolios with 1%, 5%, 10% and without allocation to Bitcoin. Table 1 shows the financial assets included in our analysis.
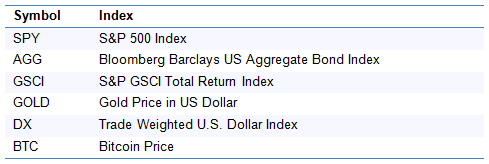
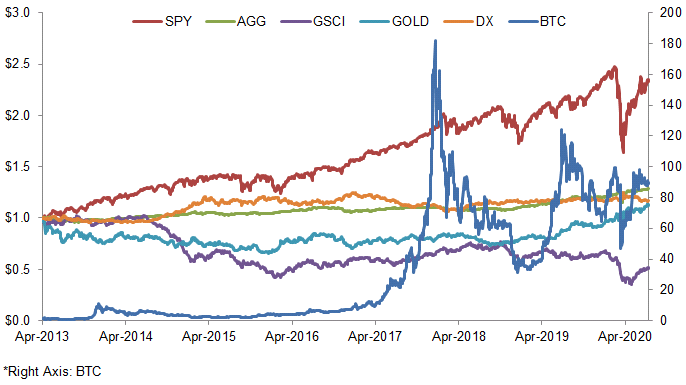
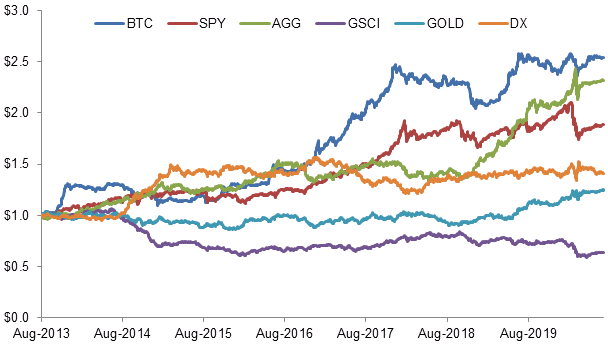
Figure 1 shows the performance of financial assets and of Bitcoin since April 2013. The price of Bitcoin explodes in 2017 from $1,037 at the beginning of that year to the peak of $18,928 in December. Figure 2 shows prices of financial assets scaled by 90-day rolling volatility.
While Bitcoin has attractive returns, it also shows a frightening volatility, which is around 5 to 10 times higher compared to other financial assets (Figure 3). There are many factors leading to the high volatility of Bitcoin, including speculations, news events, and regulations. But does it mean investors should not consider Bitcoin for their investment portfolios? To answer this question, we first examine the correlations across financial assets.
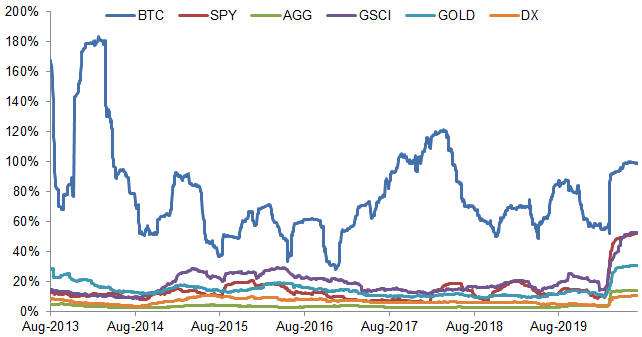
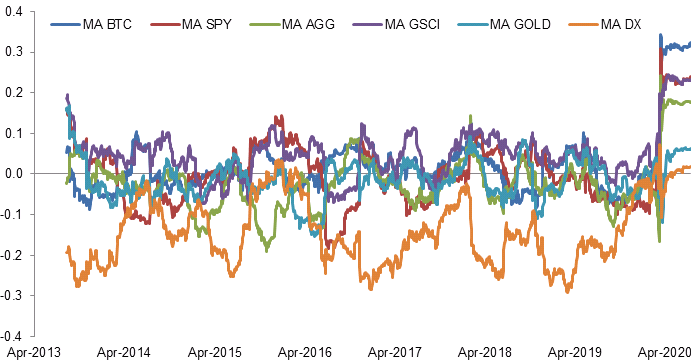
Figure 4 shows the 90-day rolling average correlations of one financial asset with the others. Bitcoin suffers a significant shock caused by the COVID-19 and moves in tandem with other financial assets in March 2020. However, we believe this phenomenon would diminish gradually, as we find that correlations usually increase under global-wide market shocks like the COVID-19 pandemic (for details: Which Portfolios Outperformed during the Covid Crisis?). In fact, before the global financial market turbulence early this year, Bitcoin has very low correlations with other financial asset classes (Table 2).
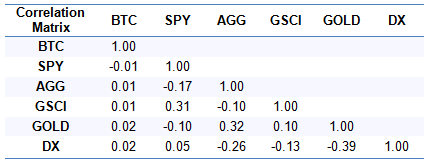
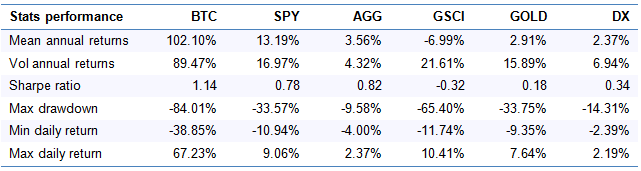
The reasons that Bitcoin could be traded as an uncorrelated asset are specific drivers of its return. As one of the crypto currencies, the price of Bitcoin is influenced by factors such as the technology development, regulatory and the market adoption. Because of the nearly zero correlations of Bitcoin with other assets and the modern portfolio theory, we expect a portfolio with allocation to Bitcoin would bring a higher risk-adjusted performance, which we will analyze in the following section. Financial assets like equities, bonds and commodities are driven by factors such as economic growth and inflation, as analyzed in our report Impact of Macroeconomic Factors on Financial Assets and Portfolios. Because of the shared drivers among traditional financial assets, they become more related to one another. Table 3 summaries the performance of assets during our study’s time frame.
To evaluate the impact of Bitcoin on a portfolio, we choose a traditional 60/40 portfolio as the benchmark and compare it performance with performance of portfolios with 1%, 5% and 10% allocation to Bitcoin.
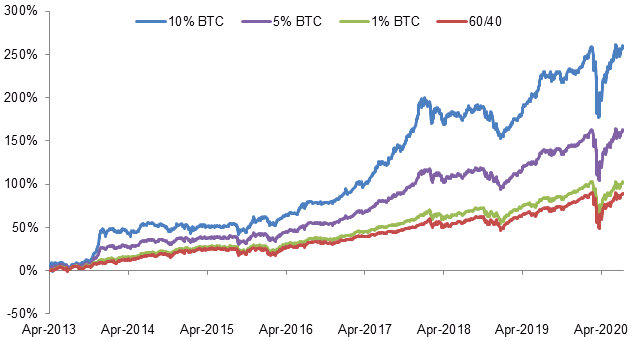
Figure 5 shows the performance of portfolios with different levels of allocation to Bitcoin. The results are consistent with our expectation that we can achieve superior risk-adjusted returns by allocating even just a small percentage of investment to Bitcoin. This is mainly due to the low correlation of Bitcoin with equities and bonds and its strong performance in recent years. Figure 6 shows the portfolio drawdowns for a pure 60/40 portfolio and 60/40 with a 5% allocation to Bitcoin.
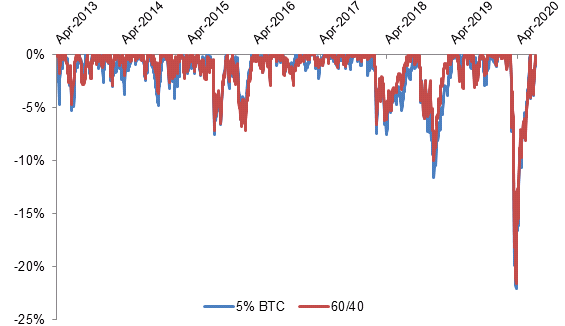
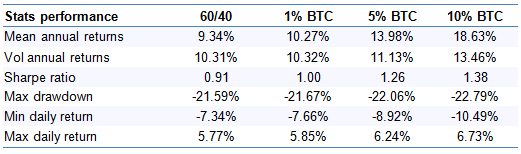
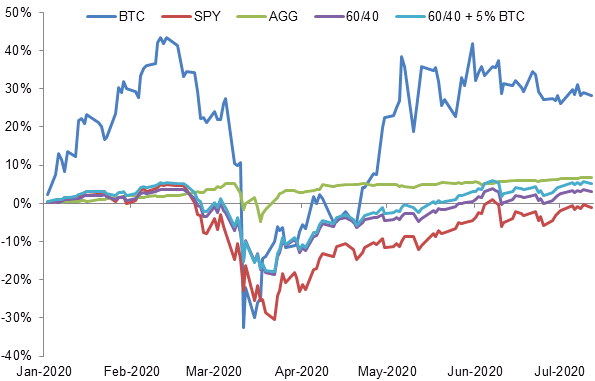
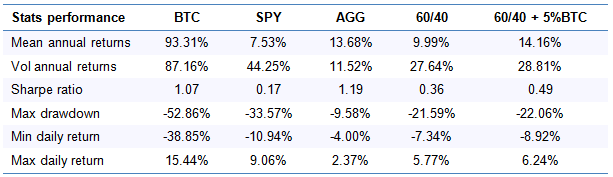
Table 4 shows portfolio performance stats. Although adding Bitcoin to a portfolio increase the volatility, it brings better risk-adjusted returns, with a Sharpe ratio of 1.38 for the portfolio with 10% allocation to Bitcoin, 54% to SPY and 36% to AGG. Allocations to Bitcoin enhance portfolio returns without introducing dramatic volatilities. Another reason we think that makes Bitcoin a valuable contributor to a portfolio is its resilience to macroeconomic environment (Figure 7). Similar to other assets, Bitcoin faces the market shock caused by COVID-19. But it shows resilience to such shocks. For example, the portfolio with 5% allocation to Bitcoin reaches a higher Sharpe ratio at 0.49 with a slightly increase of volatility compared to 60/40 portfolio (Table 5).
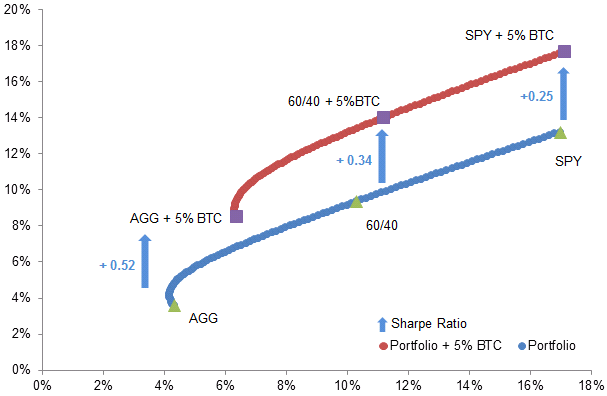
As some investors are still not familiar with digital assets like Bitcoin, they may under allocate to this asset class. According to Modern Portfolio Theory, an optimal portfolio could be achieved with a balance of risk and return. Portfolios that lie on the efficient frontier are preferred as they provide the highest returns with given levels of risk or lowest risks with defined returns. Figure 8 shows the efficient frontiers of portfolios without (in blue) and with (in red) 5% allocation to Bitcoin. The risk-adjusted return improves obviously by including Bitcoin in a portfolio. For example, the Sharpe ratio increases from 0.82 to 1.34 by allocating 5% Bitcoin to a portfolio investing in bonds (AGG) only. Bitcoin itself may seem risky, but with a well-designed allocation and trading strategy, it could significantly increase a portfolio’s risk-adjusted return.
The previous results highlight the following key insights:
Many crypto hedge funds were launched in the past 2 years because of a significant interest growth in cryptocurrencies. While some of these funds include experienced teams coming from other hedge funds, many of them were actually setup to make a quick profit during the hype.
In this article we will show why most so called crypto hedge funds are not actually hedge funds, but just passive investors in a basket of cryptocurrencies, in a way similar to mutual funds. Despite this, many of them still charge the typical 2/20 management and performance fees typical in the hedge fund world. The first section will introduce crypto hedge funds, while the second one will analyze their aggregate performance by looking at the Eurekahedge Cryptocurrency Hedge Fund Index. The last section concludes with key takeaways.
A crypto hedge fund is a pooled investment vehicle from multiple investors with the purpose of delivering uncorrelated returns with the crypto market by investing in cryptocurrencies. Cryptocurrency hedge funds are actively managed products, with the purpose of generating superior risk-adjusted returns uncorrelated with the direction of the crypto market (alpha). This is in contrast to crypto index funds, which are passively managed product with the aim of delivering just an exposure to the crypto asset class (beta).
Figure 1 shows the number of crypto fund launches, together with the price of Bitcoin. As it can be seen from the figure, there is a high correlation (ρ = 0.70) between the 2 measures. This should be expected, since a higher price of Bitcoin indicates creates greater interest in the crypto space and possibly higher capacity for crypto funds, with consequently greater economic incentives to launch one.
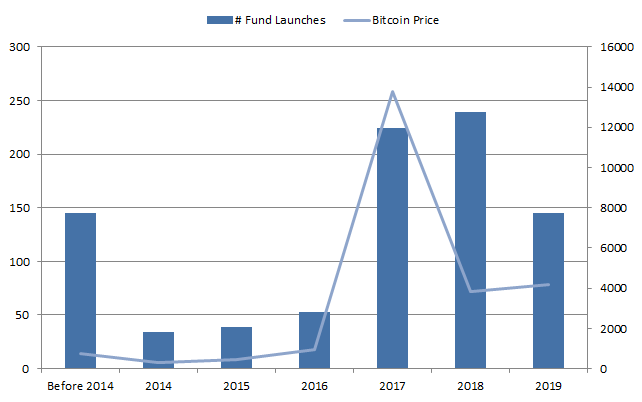
Figure 2 shows the assets under management (AUM) for crypto hedge funds over time, compared to the price of Bitcoin. It is interesting to note that, despite the bear market of 2018, crypto hedge funds still managed to attract capital. This may be due to a general interest in the crypto space, where investors may want to invest for the long term.
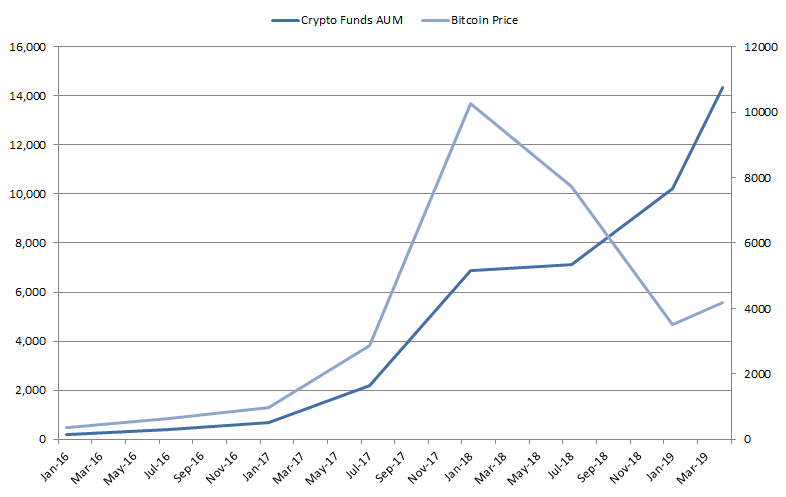
Figure 3 shows the distribution of AUM for crypto hedge funds. As it demonstrates, crypto funds are much smaller to traditional hedge funds, with most of them having less than $10 million in AUM, and only 5% surpassing the $100 million mark.
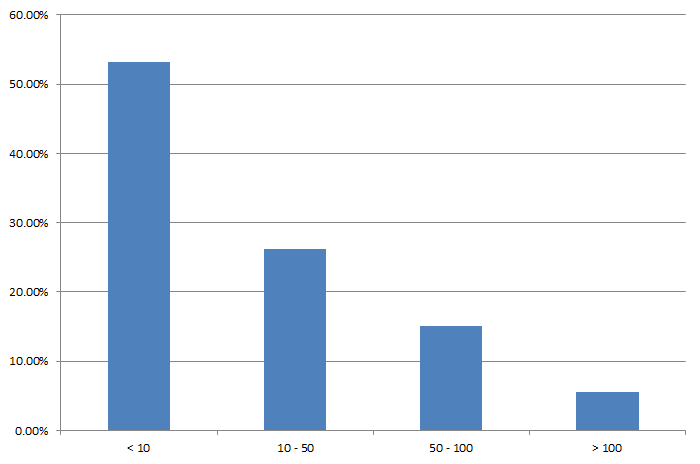
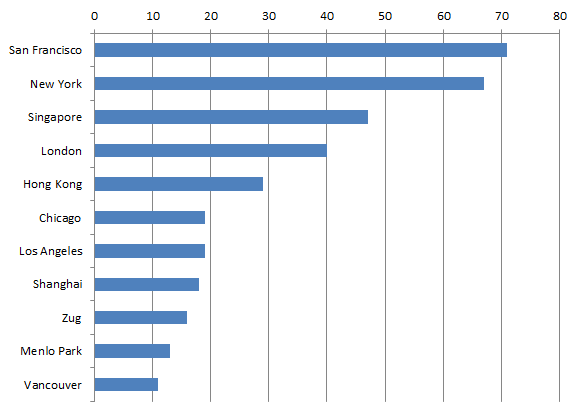
Figure 4 shows the distribution of crypto hedge funds by city. As it can be seen from it, they are dispersed across the globe, with a prevalence in major financial and tech hubs like San Francisco, New York, London, and Singapore.
We now analyze the performance of the crypto hedge fund industry as a whole to see if they provide uncorrelated returns to the markets (alpha), as they should, or if they just repackage passive cryptocurrency returns (beta). In this analysis we use the Eurekahedge Cryptocurrency Hedge Fund Index to represent the performance of a typical crypto hedge fund, and Bitcoin to represent the cryptocurrency market. The analyzed period goes from June 2013 to April 2019.
Figure 5 shows the performance of crypto hedge funds compared to Bitcoin over time. As it can be seen from it, the 2 series look very similar, posing into doubt the validity of crypto hedge funds as alpha products.
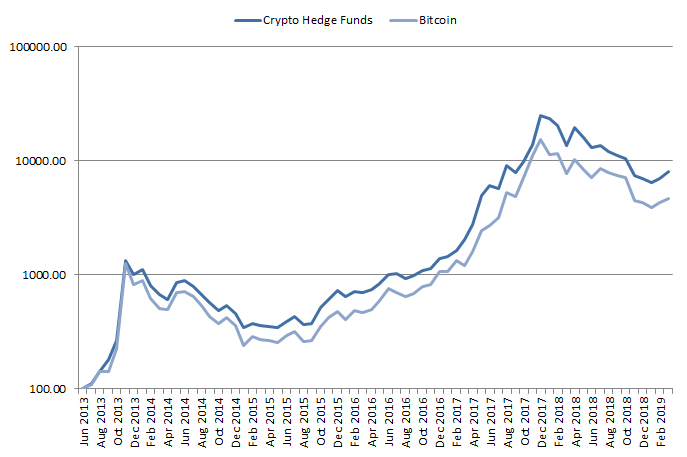
Table 1 displays the performance stats for crypto hedge funds compared to Bitcoin. As the table shows, the 2 products present very similar characteristics, with both similar returns and volatility.
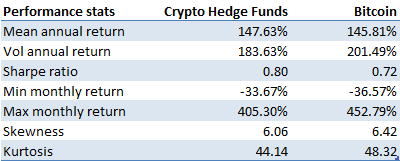
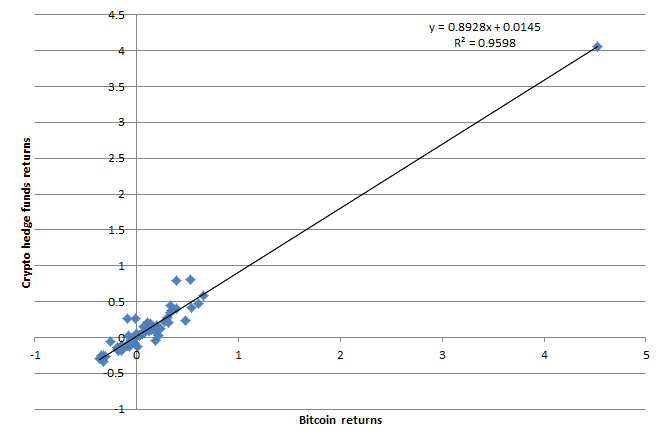
Figure 6 shows the relationship between Bitcoin returns and crypto hedge funds, while Table 2 quantifies it with a linear regression analysis. As it can be seen from them, crypto hedge funds are actually beta providers instead of alpha products as they should be. Their beta is actually 0.9, alpha is quite small (0.01) compared to their beta, and correlation with the crypto market 0.98. This is what should be expected by a mutual fund or crypto index fund offering some kind of exposure to the crypto market to its investors. These products are usually cheaper than hedge funds structures, since they do not require expensive resources spent for active management of the fund.
In the next section we analyze the performance a hypothetical systematic long/short crypto investment strategy, a possible crypto hedge fund strategy, and see if it delivers alpha as should be expected, contrary to the previous analyses.
Figure 7 shows the backtested performance net of transaction costs of a hypothetical systematic long-short crypto investment strategy applied to the top 14 cryptocurrencies by traded volume. The strategy is compared to a passive buy-and-hold investment in Bitcoin. As it can be seen from the figure, the strategy would have achieved a better performance compared to Bitcoin, which is also consistent across both bull and bear markets. This is what it should be expected from a hedge fund strategy, in other words delivering uncorrelated positive returns irrespective of market conditions.
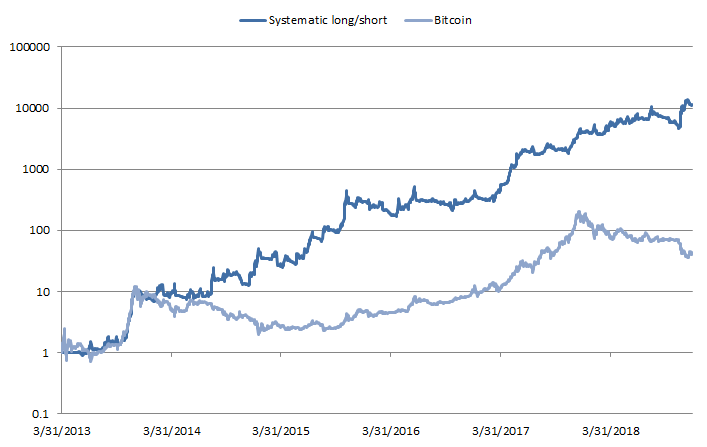
Table 3 shows the performance measures for the hypothetical systematic long/short crypto strategy and compares it to a passive investment in Bitcoin. As the table shows, the systematic long/short would have outperformed a passive Bitcoin investment. On the return side, it would have achieved an annual average return of 224%, almost double both Bitcoin. On the risk side, it would have had slightly more volatility than Bitcoin. As a result of the better return delivered with around the same amount of risk, the strategy would have achieved a much better Sharpe ratio of 1.96, compared to 1.18 for Bitcoin.
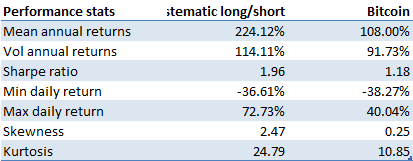
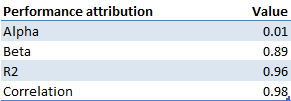
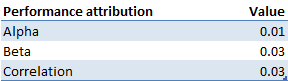
Table 4 shows the performance attribution stats for the hypothetical systematic long/short crypto strategy compared to Bitcoin. As it can be seen from the results, the strategy would have delivered real positive alpha. In fact, both beta and correlation with respect to Bitcoin returns are almost 0, as it should be expected for an alpha investment product like a hedge fund.
In conclusion, based on the previous results, a hypothetical systematic long/short crypto investment strategy would have delivered alpha instead of beta and is therefore a good candidate as a proper crypto hedge fund strategy.
Based on the previous analyses, we can derive the following key takeaways:
Cryptocurrencies experienced significant interest during the past 2 years. Many investors and companies became attracted to the market because of the apparently high returns they could get from this new asset class. At the same time, those investors who bought cryptocurrencies in late 2017 sustained a significant loss and drawdown in the bear market of 2018. Among these investors there were ICO companies and crypto miners, who were long cryptocurrencies because of the nature of their capital raising process and operations.
These experiences made people realize the importance of having a proper risk management framework in place to handle the extreme volatility level and risk present in the crypto market. A possible way to reduce price risk for crypto holders is to implement a passive or active crypto hedging program.
In this article, we outline how investors can hedge their crypto exposure and the relative transaction costs. In particular, section 1 discusses various methods of hedging a cryptocurrency exposure. The second section performs a transaction cost analysis (TCA) on the previously introduced methods and estimates transaction costs as a function of traded notional. The third section concludes.
Table 1 shows the main methods to trade and hedge crypto holdings, with both advantages and disadvantages.
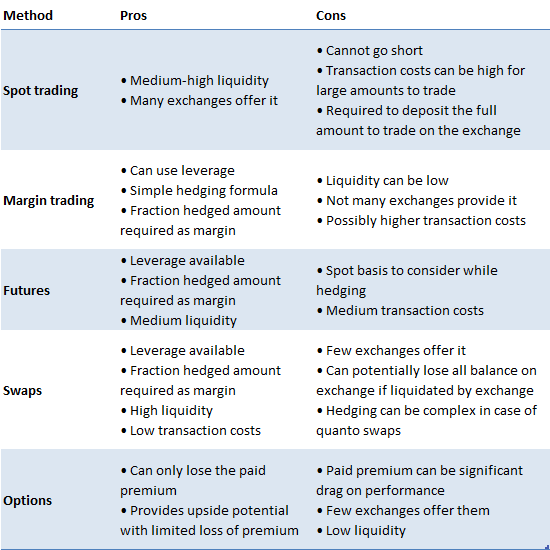
In the next subsections we review the characteristics of each method.
Spot trading is the simplest and most common method to trade cryptocurrencies. In order to do this, people need to deposit an amount of fiat on the crypto exchanges where they want to trade and start buying crypto. The main disadvantage is that investors cannot go short, so they cannot profit from bear markets like the one in 2018. Liquidity for spot trading is usually quite high, and it is available on many exchanges all over the world.
Margin trading consists in being able to trade depositing only a certain percentage of traded notional (leverage). Usually with margin trading comes the ability to borrow and short sell cryptocurrencies through loans from other participants on an exchange. In order to do so, the borrower will pay a margin fee to the lender to compensate him for the service. The major benefit of trading of margin is the ability to go short, hence potentially profit from bear markets, even if in these cases margin costs are likely to be higher. Additionally, hedging a crypto exposure is possible and only a fraction of the total hedged amount needs to be deposited on the exchange. Liquidity on exchanges that offer margin trading is usually medium high, so transaction costs are medium-low.
Futures are a derivative contract that allows investors to participate in the underlying crypto market without holding it. The main benefit of trading futures is the embedded leverage and possibility to go both long and short. Because of it, an investor like an ICO company or a crypto miner can hedge its position just by depositing a fraction of the entire amount. Liquidity for crypto futures is usually medium, and the product is offered only on a few exchanges. In addition, while hedging basis risk, i.e. the difference between the futures price and the underlying spot price before the settlement date, needs to be taken into account.
Swaps are derivative contracts that allow two counterparties to exchange payments according to a specified method. Similarly to futures, they allow the investor to go both long and short, and require only a fraction of the traded notional as margin to open a position. In addition, they have very low basis risk, since the counterparties receive payments on a frequent and periodic basis given by the difference between the swap price and the underlying spot. Liquidity is usually very high, allowing big holders of cryptocurrencies to hedge their position with the lowest transaction costs available across all analyzed methods. At the moment, only a handful of exchanges offer trading in crypto swaps, and participants on some of these exchanges can potentially lose all their margin or balance on exchange if liquidated. Furthermore, hedging can be quite complex for a quanto swap (e.g. Ethereum), where the correlation with another instrument needs to be taken into account.
Options gives the buyer the possibility, but not the obligation, to buy (call) or sell (put) the underlying instrument at the given strike price at the maturity date (European style). In other words, crypto holders can buy the required amount of put options to limit their losses if the underlying crypto price goes below a given strike price. This allows investors to participate in upside potential, but limit downside losses. This benefit comes though at the cost of expensive option premia to be paid to the option seller to compensate him for the insurance risk taken. Very few exchanges offer crypto options as of March 2019, liquidity is very low, and transaction costs quite high. This makes option hedging not a viable method to hedge an exposure for large holders of crypto like ICO companies, miners, or other institutional investors.
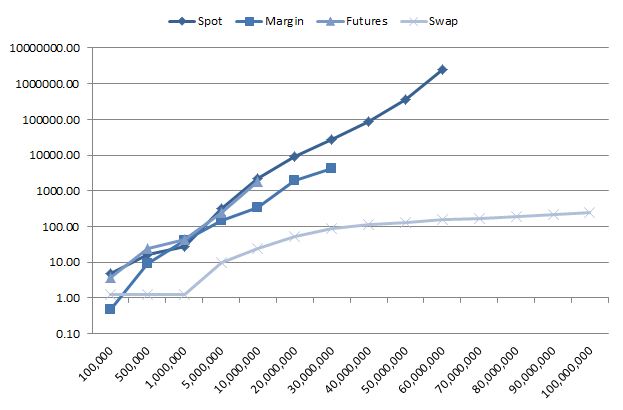
This section analyzes the transaction costs incurred in trading cryptocurrencies, in particular Bitcoin, used the methods outlined before. We found that liquidity for trading options is very low, in the order of thousands of dollars, so we omit the analysis for options as a consequence. We used exchanges representative of each type of trading method. In particular, we chose Coinbase Pro for spot trading, Bitmex for futures and swaps, and Bitfinex for margin trading. Using order book data as of April 1 2019, we analyze the market impact costs of executing immediately an order ranging from $100K up to $100 million. The costs are expressed in basis points (1 bps = 1 / 100 % = 1 / 10000) and include both spread and market impact. The costs do not include fees charged by the exchange as they are usually dependent on monthly trading volume, but they roughly range from 7.5 bps to 20 bps for traded notional.
Table 2 and Figure 1 show the transaction costs in bps for executing a sell order for various amounts of traded notional.
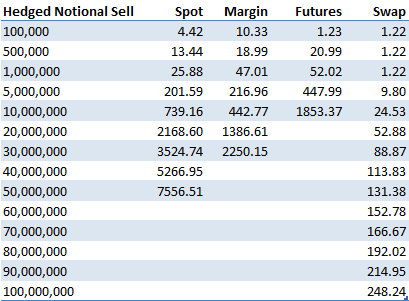
As it can be seen from them, in order to hedge some crypto holdings by going short an equivalent amount in spot or derivatives, swaps have the minimum transaction costs being the most liquid. At the same time, all other methods incur transaction costs which are exponential in the traded amount.
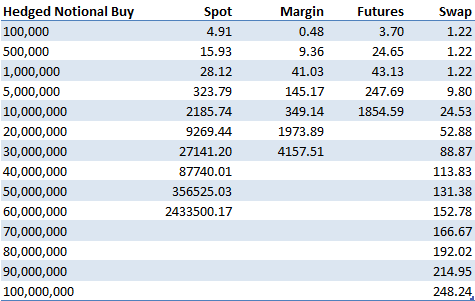
Table 3 and Figure 2 show the transaction costs for executing a buy order. The same conclusion for the sell order applies in this case, with the linear transaction costs for swaps and exponential for the other three methods.
We now quantify the relationship between traded amount and transaction costs. Figure 3 shows it for spot trading in Bitcoin on Coinbase Pro.
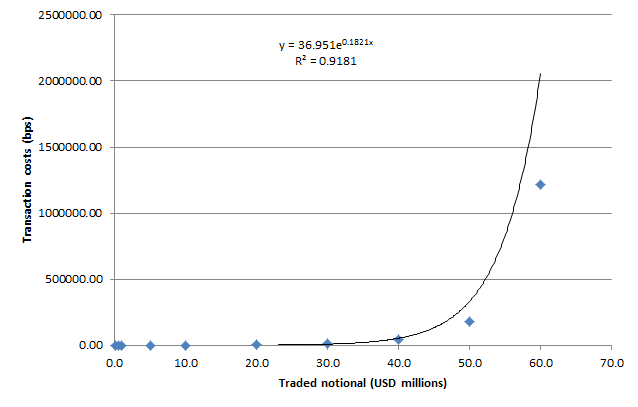
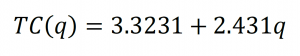
As the figure shows, the relationship is exponential, with a very good approximation (R2 = 0.92). The following relationship holds:
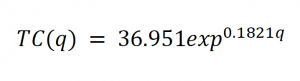
Where:
q = traded notional in USD millions
TC(q) = transaction costs as a function of traded notional
Figure 4 shows the relationship between traded notional and transaction costs for swaps. As the figure shows, the relationship is linear in this case (R2 = 0.99), even for large traded amounts. This is due to the high liquidity of the swap contract, being also the most actively traded as of April 2019, with daily traded volume around $1 billion.
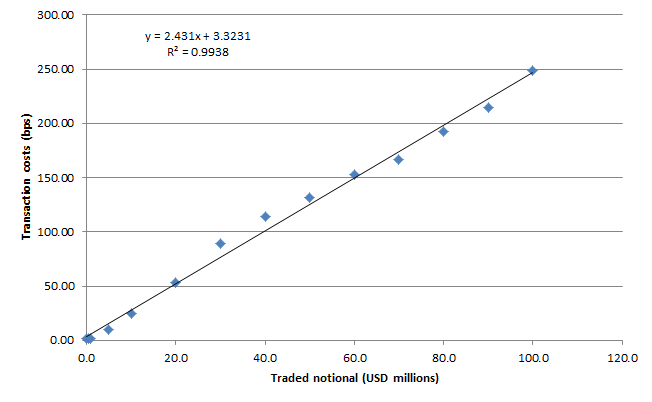
The estimated relationship between transaction costs and traded notional in the case of swaps is the following:
Where:
q = traded notional in USD millions
TC(q) = transaction costs as a function of traded notional
Based on the previous analyses, we can conclude the following:
Many companies in 2017 and 2018 decided to raise capital through an ICO by issuing tokens in exchange of cryptocurrencies like Bitcoin or Ethereum. We find that, while these firms managed to raise billions of dollars in this period, they didn’t manage their crypto holdings price risk, losing on average around 80% of the entire amount raised with the ICO. As a consequence, existing and new ICO companies should start adopting a proper ICO treasury management and crypto hedging program. This will allow them to minimize the risk of losing the capital raised during the ICO, because of the high volatility present in cryptocurrencies (~100% annualized volatility), and to meet their expenses in fiat.
This research paper is structured as follows. The first section gives an overview of the ICO market, with corresponding raised amounts. The second analyzes the volatility in cryptocurrency prices, Bitcoin and Ethereum in particular as they are the major cryptocurrencies accepted by ICO companies. The third section examines the ICO treasury management practices of a sample of ICO firms, showing their inability in managing their reserves properly. The fourth section concludes with key takeaways.
During the period between September 2015 and March 2019, ICO’s companies raised a total of around $24 billion, with an average of $15.5 million per ICO. Table 1 shows the top 20 ICO’s by amount of capital raised.

Figure 1 shows the top 20 countries where those ICO’s companies are domiciled. It is interesting to note that despite tighter security laws and scrutiny from the SEC, the United States comes first, followed by Singapore and the UK.
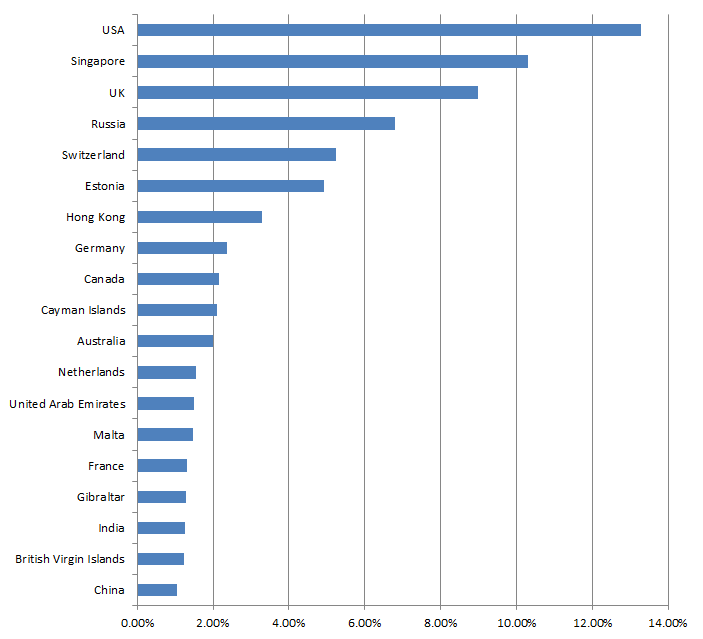
Figure 2 shows the category distribution of the analyzed ICO’s projects. Platform ICO’s come first, followed by cryptocurrency, business services and investments.

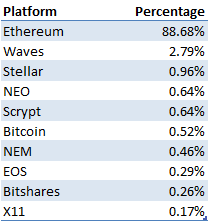
Table 2 shows the top 10 platforms used by the ICO projects to issue their tokens. As it shows, Ethereum is the major one with the ERC20 tokens, constituting around 90% of the tokens issued.

Figure 3 shows the distribution of accepted cryptocurrencies from ICO firms for their capital raising process. As it can be seen from it, the most accepted cryptocurrency is Ethereum, constituting around 45% of all analyzed projects, followed by Bitcoin at 22%. As a consequence, in this article we will focus on the price risk of Ethereum balances.
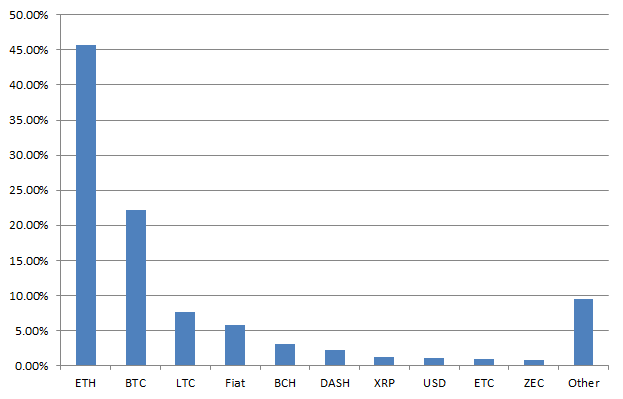
Figure 4 shows the price of Ethereum from September 2016 until March 2019. As it can be seen from it, cryptocurrencies, in this case Ethereum, are very volatile. The price went in fact from around $12 at the start of the considered period, to a maximum of $1400 in December 2018, and back again to around $140 as of March 2019.
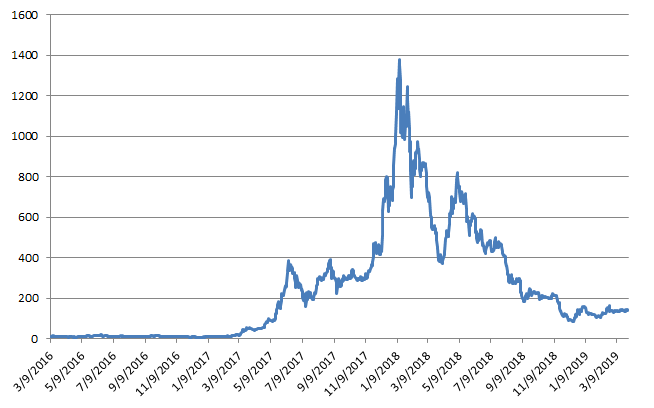
Figure 5 shows the rolling 60-day volatility of Ethereum. As it can be seen from it, Ethereum is very volatile, with an average annualized volatility of around 112% for the considered period.
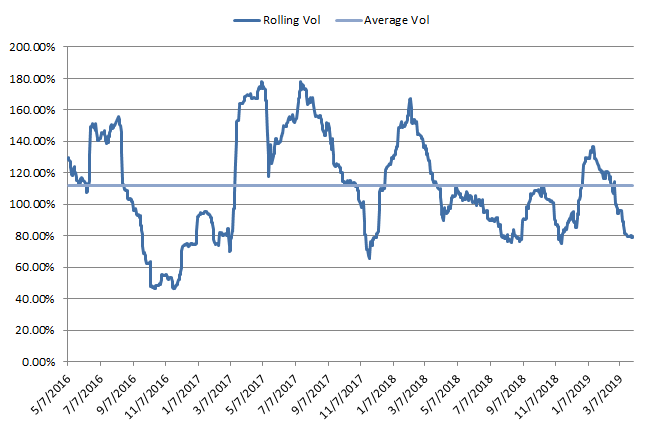
Figure 6 shows the drawdown for a buy and hold strategy in Ethereum. As it can be seen from it, a buy-and-hold investment in Ethereum experienced significant drawdowns, with a max drawdown of 94% and a mean drawdown of 45%. This means that an ICO company who would have raised capital at the Ethereum price peak in December 2018 and who did not liquidate its position, would have lost almost the entire fiat value of their holdings. This would have probably determined the failure of the project, since it would have not been able to meet its expenses in fiat like USD or EUR.
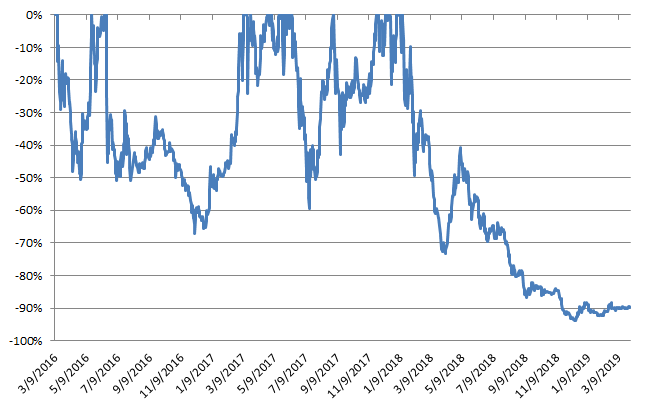
Table 3 shows the performance statistics of a buy-and-hold investment in Ethereum during the considered period.
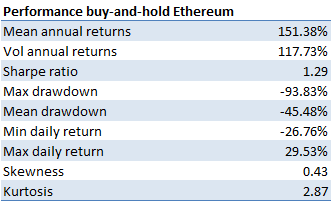
As it can be seen from it, Ethereum potentially provides high returns, with a mean annual return of 151%, but at the same very high risk, In fact, the average annualized volatility is 118%, and a max drawdown of 94%.
The previous data shows the importance for holders of cryptocurrencies like ICO companies to have a proper crypto risk management program in place to avoid losing the majority of their holdings values in fiat terms. An example of treasury management program would be a pure passive hedging program, where crypto holders lock-in their initial value of crypto holdings in fiat term. Another more dynamic approach would be an active hedging program, where they decide at which levels they want to hedge their crypto exposure. A last option would be a systematic crypto hedging program, where an algorithm analyzes the crypto data to determine when a bear market is more likely, and decides automatically on the best periods to hedge. The last two approaches would possibly provide both upside potential, and limit on downside losses.
In the next section we analyze the treasury balances of a group of ICO companies and see if they managed to implement a proper crypto risk and treasury management program.
In this section we analyze the treasury management reserves and behavior for a sample of around 50 ICO companies which have raised capital with Ethereum. Figure 7 shows the treasury balances for these companies in amounts of Ethereum. As it can be seen from it, many ICO firms still have a lot of their holdings in crypto, exposing them to a large crypto price risk and potential losses in fiat terms.
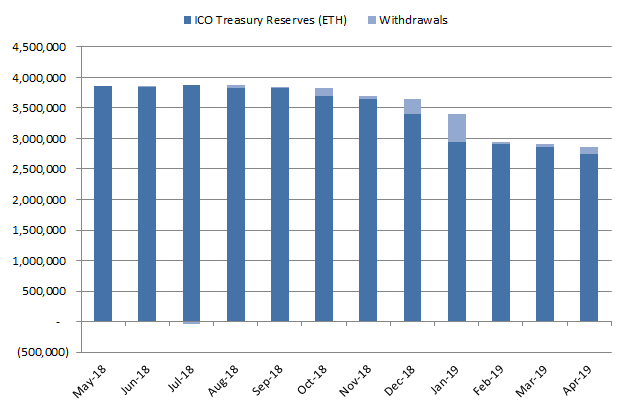
Figure 8 shows the USD value of crypto holdings for the considered ICO companies. As the figure shows, these firms lost the majority of their value in fiat terms, going from around $2.6 to about $400 million.
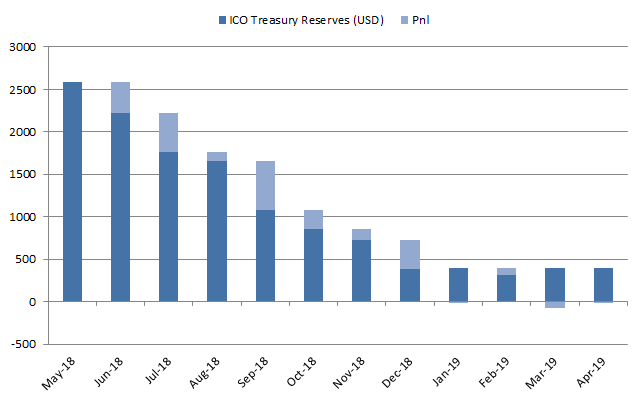
Table 4 shows the amount lost by these ICO companies because of change in Ethereum price, excluding the effect of withdrawals. As it indicates, the average ICO company lost around 73% of the value of their crypto holdings due to a improper treasury management practices. This poses into question the ability of these projects in being able to pay their ongoing and future expenses without raising additional capital.
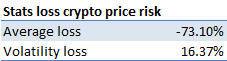
Figure 9 provides an additional piece of evidence in the lack of proper treasury management practices by ICO companies. As the figure shows, there is an inverse correlation (β = -1068.8) between change in Ethereum price and crypto holdings liquidated from treasury reserves. This is the opposite behavior that should be expected by good risk management practices. They in fact do not sell before Ethereum experiences losses, sitting on unrealized losses and hoping for a possible price increase in the future.
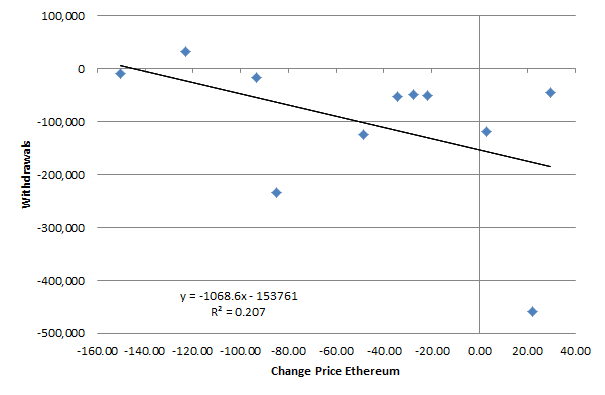
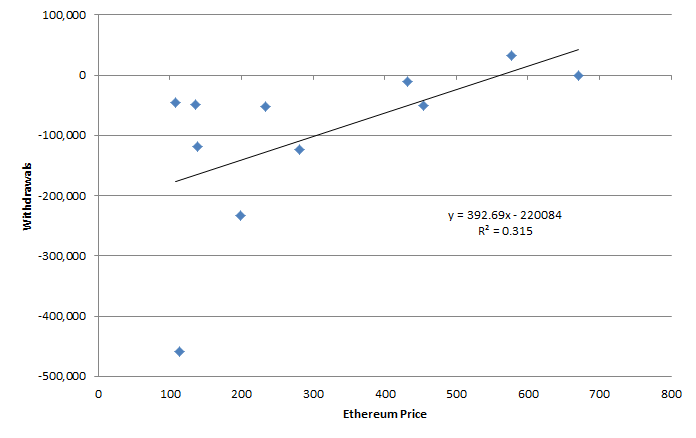
Figure 10 further validates the previous conclusion. As it can be seen from it, the analyzed ICO firms do not sell their holdings when the price of Ethereum is high, but instead made most of their withdrawals when the price was at its minimum. A good treasury management practice should do the opposite, i.e. sell only when the price is high.
This data shows that ICO firms are not adopting sound treasury management policies. They should as a consequence consider implementing a crypto hedging program, or delegating the management of their holdings to an investment professional.
The previous results highlight the following key takeaways:
Many companies in 2017 and 2018 decided to raise capital through an Initial Coin Offering (ICO). While the process seemed very promising at the beginning, it also showed its limitations around the end of 2018. In fact, many ICO’s were in fact scams, while other failed to deliver the promises towards their investors. In this research paper we analyze the ICO market from 2015 until present. The first section gives an overview of the ICO market. The second section analyzes more in detail the evolution of the ICO capital raising process over time, while the third section analyzes the main factors driving the ICO capital raise. The fourth section concludes with key takeaways.
For this research we used the info on around 3500 ICO’s completed between September 2015 and March 2019. During this period, ICO’s companies raised a total of around $24 billion, with an average of $15.5 million per ICO. Table 1 shows the top 20 ICO’s by amount of capital raised.
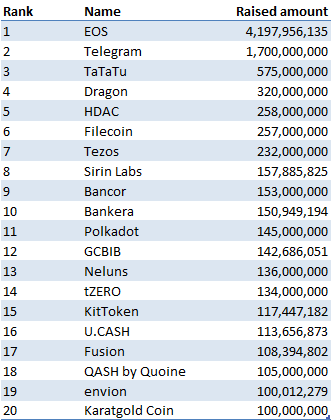
Figure 1 shows the top 20 countries where those ICO’s companies are domiciled. It is interesting to note that despite tighter security laws and scrutiny from the SEC, the United States comes first, followed by Singapore and the UK.

Figure 2 shows the category distribution of the analyzed ICO’s projects. Platform ICO’s come first, followed by cryptocurrency, business services and investments.
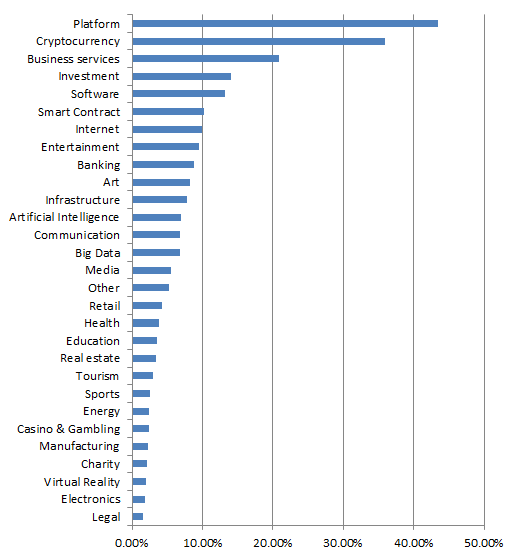
Table 2 shows the type of ICO used. Utility is the great majority at 97%, used mainly initially for regulatory purposes to avoid security laws in many countries. Despite the recent hype in Security Tokens Offerings (STO’s), they only represent about 2% of the total ICO’s so far. We’ll need to see in the coming years if they become the predominant form of ICO type.
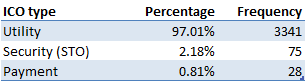
Table 3 shows the status of the completed ICO’s. It is interesting to note that, while many proponents of the ICO model claim liquidity as one main benefit of ICO’s, only around 20% of the completed ICO’s are actually listed for trading on an exchange. This shows that the vast majority of participants in ICO’s were not able to exit their position. This is similar to investing in an offering in a private early-stage company, where exit strategies at the beginning are limited.
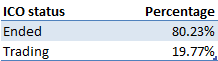
Figure 3 shows the distribution of number of team members for each ICO project. As it can be seen from it, it is a bimodal distribution, with peaks at 1 person and around 8 people.
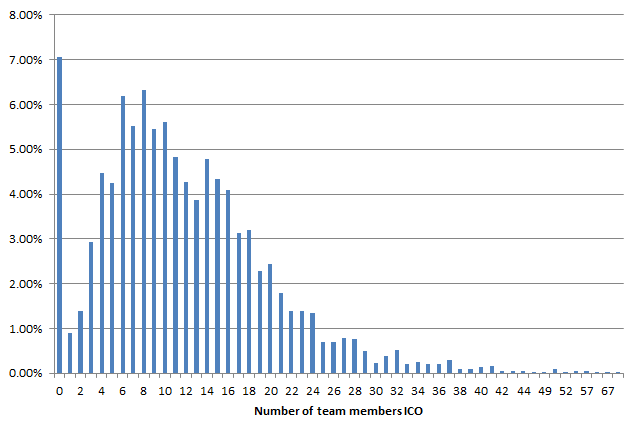
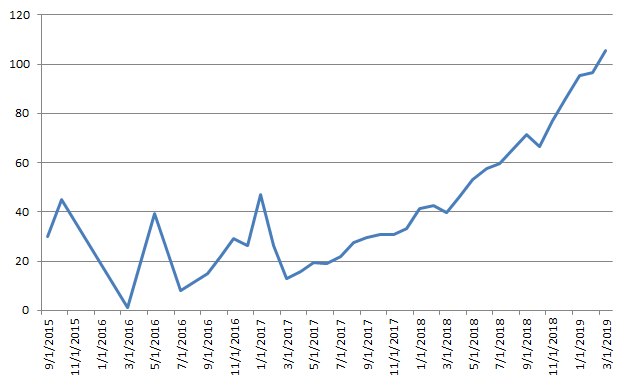
Figure 4 shows the average number of team members over time. As it can be seen from it, there is a steady uptrend in this number, going from around 5 in 2016 to around 15 as of 2019. This possibly indicates greater professionalism and experience in the recent ICO teams compared to the initial ones, and a maturation of the market and its participants.
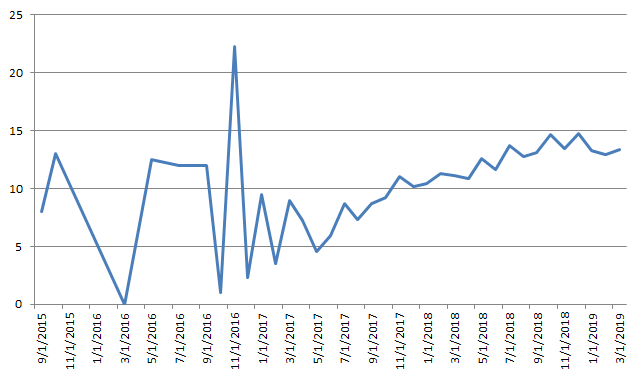
Table 4 shows the top 10 platforms used by the ICO projects to issue their tokens. As it shows, Ethereum is the major one with the ERC20 tokens, constituting around 90% of the tokens issued.
This section analyzes the ICO raising process over time from September 2015 to March 2019. Figure 5 shows the number of ICO’s vs the price of Bitcoin during the period analyzed. As it can be seen from it, the number of launched ICO’s is highly correlated to the price of Bitcoin. This makes sense, since it is the price increase in Bitcoin during the considered period that gave rise to the popularity of cryptocurrencies and draw more capital in the ICO market.
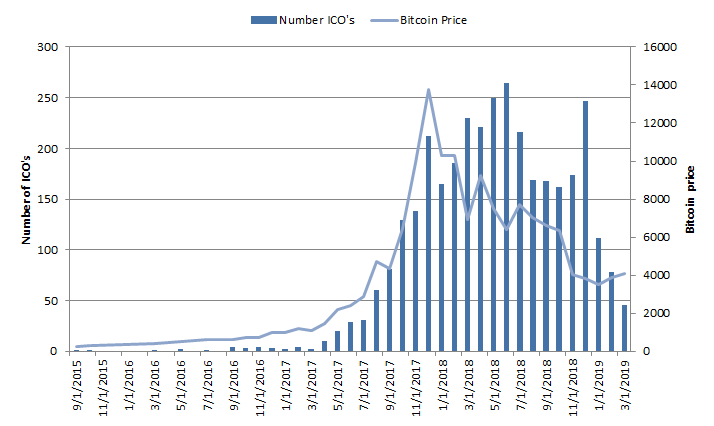
Figure 6 shows the total capital raised for each month compared to the price of Bitcoin. A similar conclusion to what previously discussed applies. In fact, the total amount raised is greatly correlated to the price of Bitcoin.
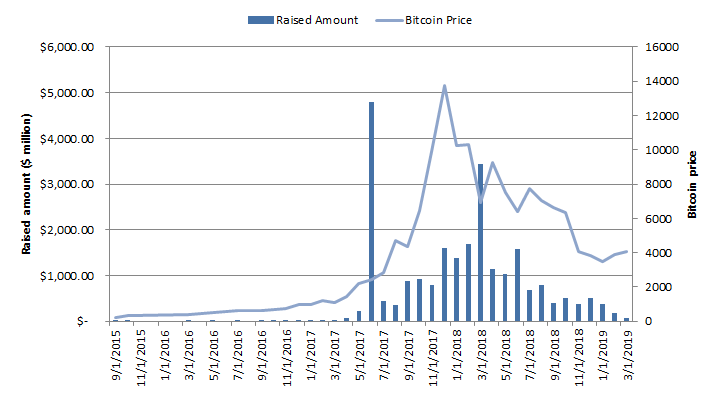
Figure 7 shows the average amount raised per ICO each month on a log scale. As the figure shows and contrary to what it could be expected, the amount has been relatively constant around $15 million since August 2017. This indicates that, despite the decreased interest in the ICO market and slowdown in total amount raised and project launched, successful ICO companies can still expect to raise around the same level of capital as before the bear the market of 2018.
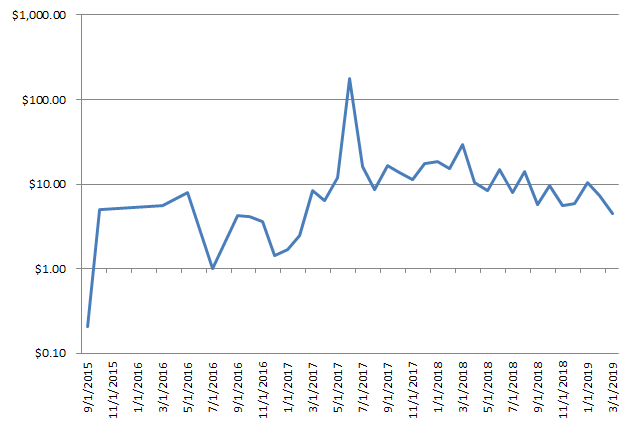
Figure 8 shows the average duration to complete an ICO. As it can be seen from it, there is a steady increase in the average time required to successfully launch an ICO, going from around 30 days in 2017 to around 100 days at present times.
In the next section we will analyze more in depth the relationship between the price of Bitcoin and the capital raised through the ICO process.
Figure 9 shows the relationship between the Bitcoin price and the number of ICO’s launched each month for the analyzed period. As it can be seen from it, there is an almost perfect log-log relationship between the 2 variables (R2 = 0.92). This means that one of the main factor impacting the number of new launches in the ICO market is the price of Bitcoin.
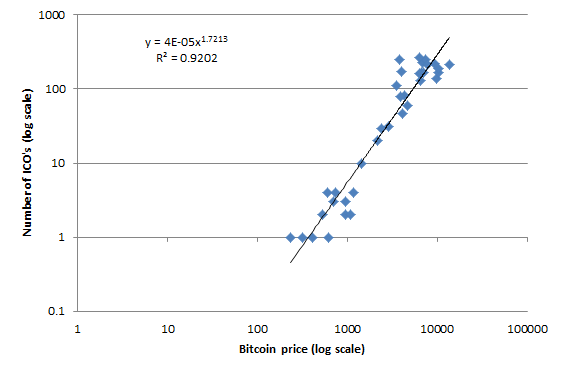
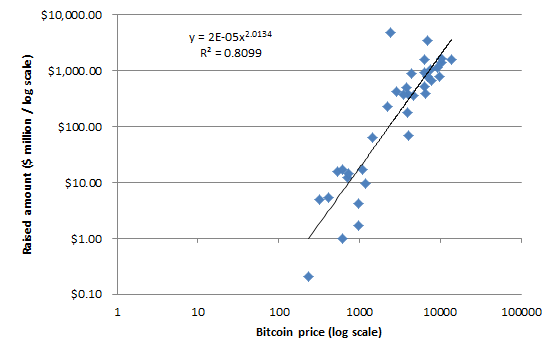
Figure 10 shows the relationship between the Bitcoin price and the total amount raised each month. Similarly to the number of launches, there is a strong log-log relationship between the 2 variables (R2 = 0.81). This makes sense, since many investors remember the losses they had in the bear market and are not willing to invest in new projects because of that. Also, an increase in price of Bitcoin drives more interest in the market, and more capital to invest as a consequence.
The previous results highlight the following key takeaways: