Cryptocurrencies experienced significant interest during the past 2 years. Many investors and companies became attracted to the market because of the apparently high returns they could get from this new asset class. At the same time, those investors who bought cryptocurrencies in late 2017 sustained a significant loss and drawdown in the bear market of 2018. Among these investors there were ICO companies and crypto miners, who were long cryptocurrencies because of the nature of their capital raising process and operations.
These experiences made people realize the importance of having a proper risk management framework in place to handle the extreme volatility level and risk present in the crypto market. A possible way to reduce price risk for crypto holders is to implement a passive or active crypto hedging program.
In this article, we outline how investors can hedge their crypto exposure and the relative transaction costs. In particular, section 1 discusses various methods of hedging a cryptocurrency exposure. The second section performs a transaction cost analysis (TCA) on the previously introduced methods and estimates transaction costs as a function of traded notional. The third section concludes.
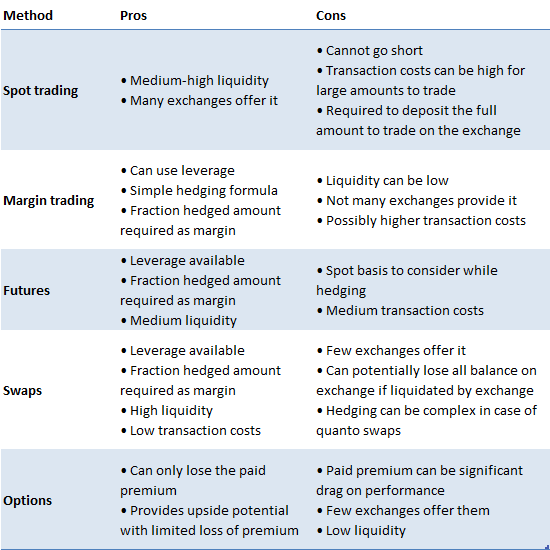
Table 1 shows the main methods to trade and hedge crypto holdings, with both advantages and disadvantages.
In the next subsections we review the characteristics of each method.
Spot trading is the simplest and most common method to trade cryptocurrencies. In order to do this, people need to deposit an amount of fiat on the crypto exchanges where they want to trade and start buying crypto. The main disadvantage is that investors cannot go short, so they cannot profit from bear markets like the one in 2018. Liquidity for spot trading is usually quite high, and it is available on many exchanges all over the world.
Margin trading consists in being able to trade depositing only a certain percentage of traded notional (leverage). Usually with margin trading comes the ability to borrow and short sell cryptocurrencies through loans from other participants on an exchange. In order to do so, the borrower will pay a margin fee to the lender to compensate him for the service. The major benefit of trading of margin is the ability to go short, hence potentially profit from bear markets, even if in these cases margin costs are likely to be higher. Additionally, hedging a crypto exposure is possible and only a fraction of the total hedged amount needs to be deposited on the exchange. Liquidity on exchanges that offer margin trading is usually medium high, so transaction costs are medium-low.
Futures are a derivative contract that allows investors to participate in the underlying crypto market without holding it. The main benefit of trading futures is the embedded leverage and possibility to go both long and short. Because of it, an investor like an ICO company or a crypto miner can hedge its position just by depositing a fraction of the entire amount. Liquidity for crypto futures is usually medium, and the product is offered only on a few exchanges. In addition, while hedging basis risk, i.e. the difference between the futures price and the underlying spot price before the settlement date, needs to be taken into account.
Swaps are derivative contracts that allow two counterparties to exchange payments according to a specified method. Similarly to futures, they allow the investor to go both long and short, and require only a fraction of the traded notional as margin to open a position. In addition, they have very low basis risk, since the counterparties receive payments on a frequent and periodic basis given by the difference between the swap price and the underlying spot. Liquidity is usually very high, allowing big holders of cryptocurrencies to hedge their position with the lowest transaction costs available across all analyzed methods. At the moment, only a handful of exchanges offer trading in crypto swaps, and participants on some of these exchanges can potentially lose all their margin or balance on exchange if liquidated. Furthermore, hedging can be quite complex for a quanto swap (e.g. Ethereum), where the correlation with another instrument needs to be taken into account.
Options gives the buyer the possibility, but not the obligation, to buy (call) or sell (put) the underlying instrument at the given strike price at the maturity date (European style). In other words, crypto holders can buy the required amount of put options to limit their losses if the underlying crypto price goes below a given strike price. This allows investors to participate in upside potential, but limit downside losses. This benefit comes though at the cost of expensive option premia to be paid to the option seller to compensate him for the insurance risk taken. Very few exchanges offer crypto options as of March 2019, liquidity is very low, and transaction costs quite high. This makes option hedging not a viable method to hedge an exposure for large holders of crypto like ICO companies, miners, or other institutional investors.
This section analyzes the transaction costs incurred in trading cryptocurrencies, in particular Bitcoin, used the methods outlined before. We found that liquidity for trading options is very low, in the order of thousands of dollars, so we omit the analysis for options as a consequence. We used exchanges representative of each type of trading method. In particular, we chose Coinbase Pro for spot trading, Bitmex for futures and swaps, and Bitfinex for margin trading. Using order book data as of April 1 2019, we analyze the market impact costs of executing immediately an order ranging from $100K up to $100 million. The costs are expressed in basis points (1 bps = 1 / 100 % = 1 / 10000) and include both spread and market impact. The costs do not include fees charged by the exchange as they are usually dependent on monthly trading volume, but they roughly range from 7.5 bps to 20 bps for traded notional.
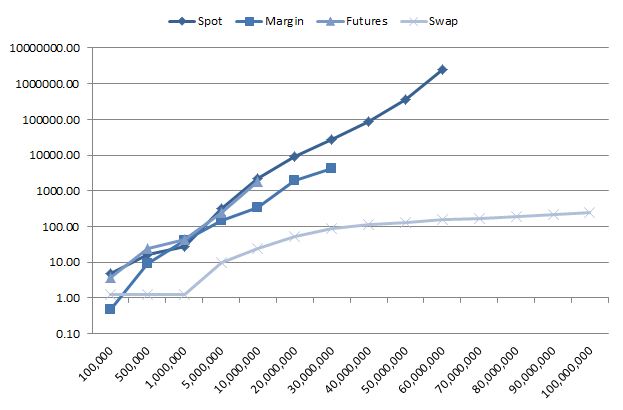
Table 2 and Figure 1 show the transaction costs in bps for executing a sell order for various amounts of traded notional.
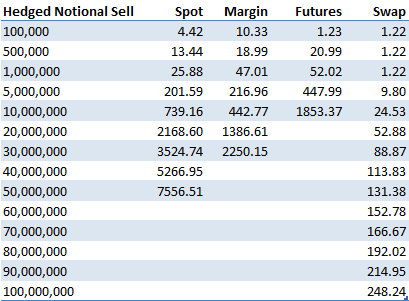
As it can be seen from them, in order to hedge some crypto holdings by going short an equivalent amount in spot or derivatives, swaps have the minimum transaction costs being the most liquid. At the same time, all other methods incur transaction costs which are exponential in the traded amount.
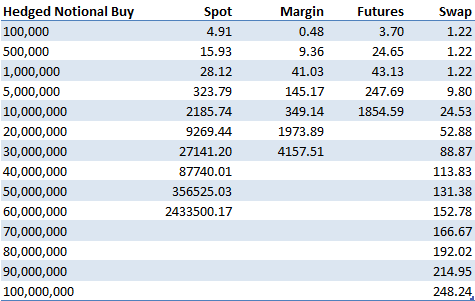
Table 3 and Figure 2 show the transaction costs for executing a buy order. The same conclusion for the sell order applies in this case, with the linear transaction costs for swaps and exponential for the other three methods.
We now quantify the relationship between traded amount and transaction costs. Figure 3 shows it for spot trading in Bitcoin on Coinbase Pro.
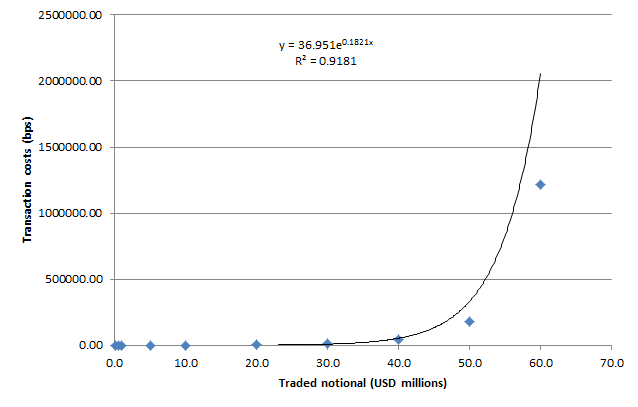
As the figure shows, the relationship is exponential, with a very good approximation (R2 = 0.92). The following relationship holds:
Where:
q = traded notional in USD millions
TC(q) = transaction costs as a function of traded notional
Figure 4 shows the relationship between traded notional and transaction costs for swaps. As the figure shows, the relationship is linear in this case (R2 = 0.99), even for large traded amounts. This is due to the high liquidity of the swap contract, being also the most actively traded as of April 2019, with daily traded volume around $1 billion.
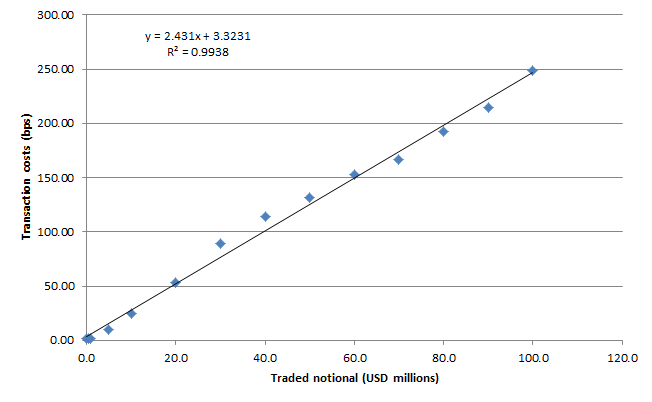
The estimated relationship between transaction costs and traded notional in the case of swaps is the following:
Where:
q = traded notional in USD millions
TC(q) = transaction costs as a function of traded notional
Based on the previous analyses, we can conclude the following:
Many companies in 2017 and 2018 decided to raise capital through an ICO by issuing tokens in exchange of cryptocurrencies like Bitcoin or Ethereum. We find that, while these firms managed to raise billions of dollars in this period, they didn’t manage their crypto holdings price risk, losing on average around 80% of the entire amount raised with the ICO. As a consequence, existing and new ICO companies should start adopting a proper ICO treasury management and crypto hedging program. This will allow them to minimize the risk of losing the capital raised during the ICO, because of the high volatility present in cryptocurrencies (~100% annualized volatility), and to meet their expenses in fiat.
This research paper is structured as follows. The first section gives an overview of the ICO market, with corresponding raised amounts. The second analyzes the volatility in cryptocurrency prices, Bitcoin and Ethereum in particular as they are the major cryptocurrencies accepted by ICO companies. The third section examines the ICO treasury management practices of a sample of ICO firms, showing their inability in managing their reserves properly. The fourth section concludes with key takeaways.
During the period between September 2015 and March 2019, ICO’s companies raised a total of around $24 billion, with an average of $15.5 million per ICO. Table 1 shows the top 20 ICO’s by amount of capital raised.
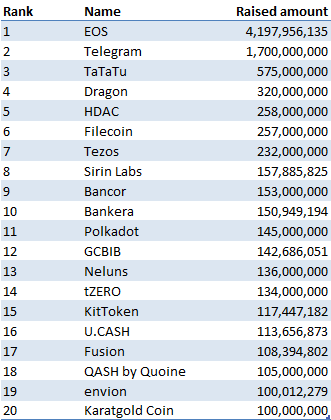
Figure 1 shows the top 20 countries where those ICO’s companies are domiciled. It is interesting to note that despite tighter security laws and scrutiny from the SEC, the United States comes first, followed by Singapore and the UK.
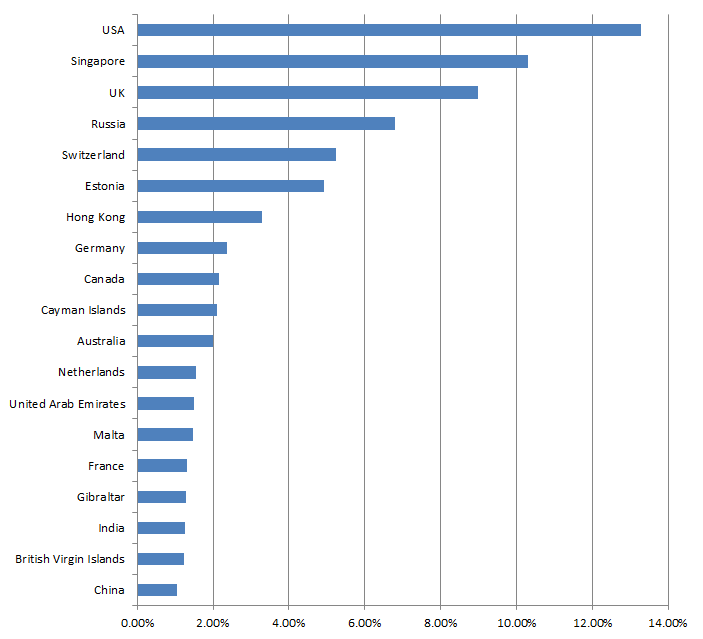
Figure 2 shows the category distribution of the analyzed ICO’s projects. Platform ICO’s come first, followed by cryptocurrency, business services and investments.
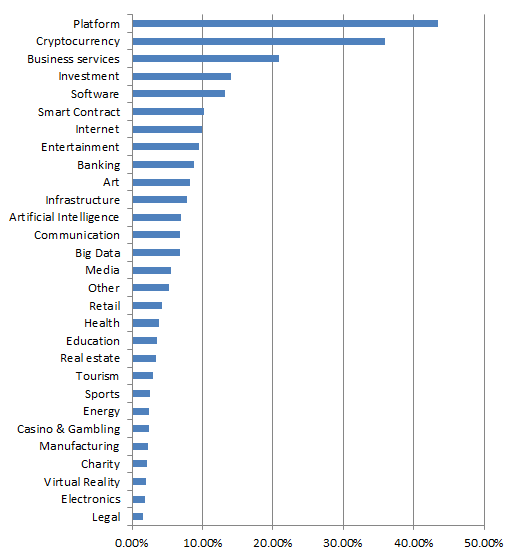
Table 2 shows the top 10 platforms used by the ICO projects to issue their tokens. As it shows, Ethereum is the major one with the ERC20 tokens, constituting around 90% of the tokens issued.
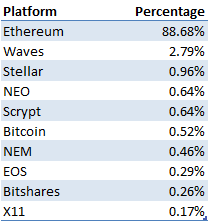
Figure 3 shows the distribution of accepted cryptocurrencies from ICO firms for their capital raising process. As it can be seen from it, the most accepted cryptocurrency is Ethereum, constituting around 45% of all analyzed projects, followed by Bitcoin at 22%. As a consequence, in this article we will focus on the price risk of Ethereum balances.
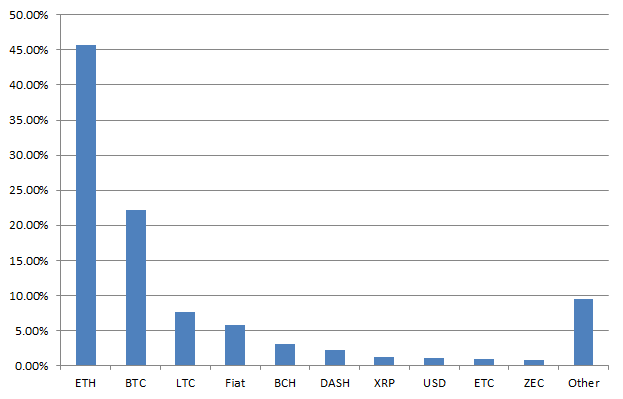
Figure 4 shows the price of Ethereum from September 2016 until March 2019. As it can be seen from it, cryptocurrencies, in this case Ethereum, are very volatile. The price went in fact from around $12 at the start of the considered period, to a maximum of $1400 in December 2018, and back again to around $140 as of March 2019.
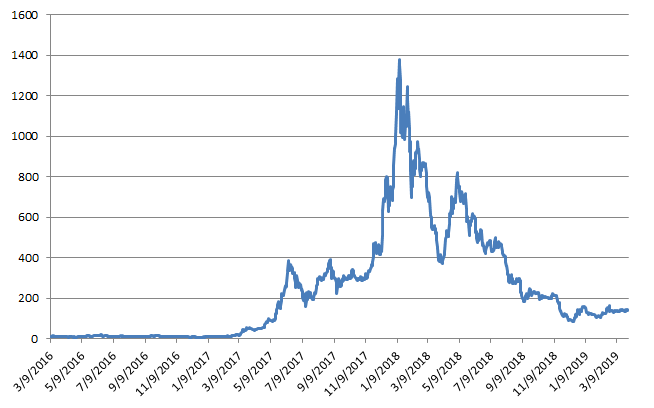
Figure 5 shows the rolling 60-day volatility of Ethereum. As it can be seen from it, Ethereum is very volatile, with an average annualized volatility of around 112% for the considered period.
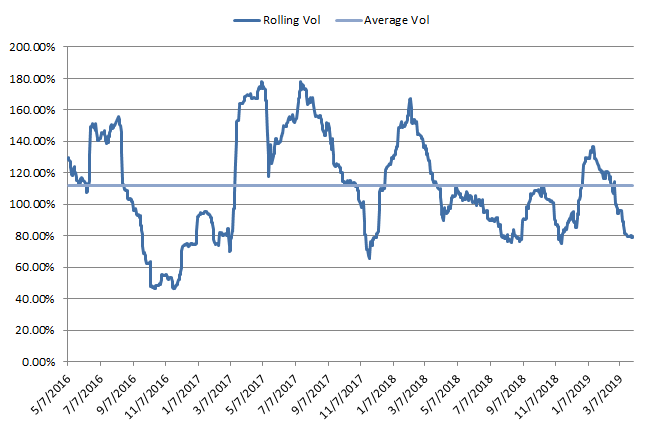
Figure 6 shows the drawdown for a buy and hold strategy in Ethereum. As it can be seen from it, a buy-and-hold investment in Ethereum experienced significant drawdowns, with a max drawdown of 94% and a mean drawdown of 45%. This means that an ICO company who would have raised capital at the Ethereum price peak in December 2018 and who did not liquidate its position, would have lost almost the entire fiat value of their holdings. This would have probably determined the failure of the project, since it would have not been able to meet its expenses in fiat like USD or EUR.
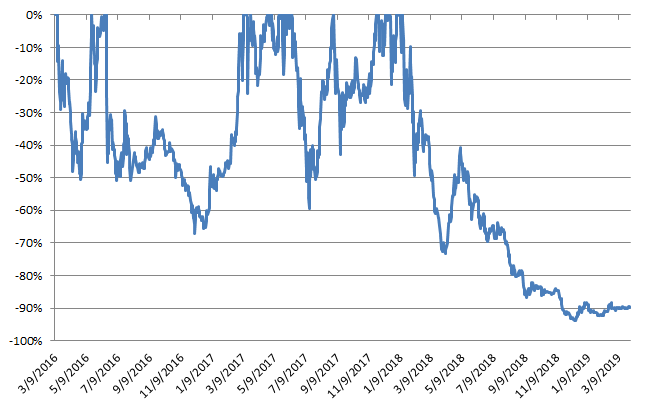
Table 3 shows the performance statistics of a buy-and-hold investment in Ethereum during the considered period.
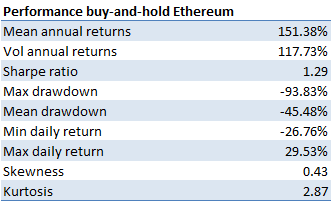
As it can be seen from it, Ethereum potentially provides high returns, with a mean annual return of 151%, but at the same very high risk, In fact, the average annualized volatility is 118%, and a max drawdown of 94%.
The previous data shows the importance for holders of cryptocurrencies like ICO companies to have a proper crypto risk management program in place to avoid losing the majority of their holdings values in fiat terms. An example of treasury management program would be a pure passive hedging program, where crypto holders lock-in their initial value of crypto holdings in fiat term. Another more dynamic approach would be an active hedging program, where they decide at which levels they want to hedge their crypto exposure. A last option would be a systematic crypto hedging program, where an algorithm analyzes the crypto data to determine when a bear market is more likely, and decides automatically on the best periods to hedge. The last two approaches would possibly provide both upside potential, and limit on downside losses.
In the next section we analyze the treasury balances of a group of ICO companies and see if they managed to implement a proper crypto risk and treasury management program.
In this section we analyze the treasury management reserves and behavior for a sample of around 50 ICO companies which have raised capital with Ethereum. Figure 7 shows the treasury balances for these companies in amounts of Ethereum. As it can be seen from it, many ICO firms still have a lot of their holdings in crypto, exposing them to a large crypto price risk and potential losses in fiat terms.
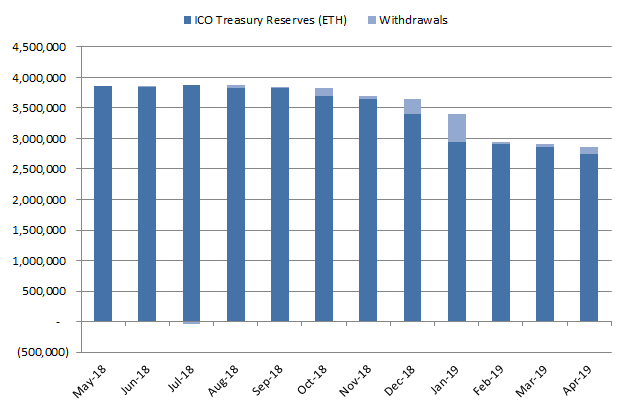
Figure 8 shows the USD value of crypto holdings for the considered ICO companies. As the figure shows, these firms lost the majority of their value in fiat terms, going from around $2.6 to about $400 million.
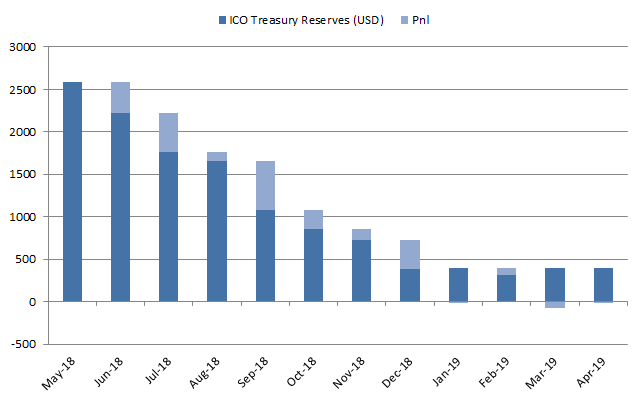
Table 4 shows the amount lost by these ICO companies because of change in Ethereum price, excluding the effect of withdrawals. As it indicates, the average ICO company lost around 73% of the value of their crypto holdings due to a improper treasury management practices. This poses into question the ability of these projects in being able to pay their ongoing and future expenses without raising additional capital.
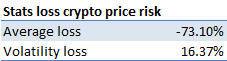
Figure 9 provides an additional piece of evidence in the lack of proper treasury management practices by ICO companies. As the figure shows, there is an inverse correlation (β = -1068.8) between change in Ethereum price and crypto holdings liquidated from treasury reserves. This is the opposite behavior that should be expected by good risk management practices. They in fact do not sell before Ethereum experiences losses, sitting on unrealized losses and hoping for a possible price increase in the future.
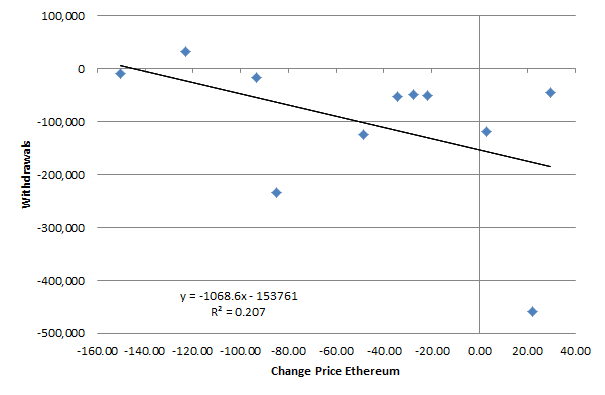
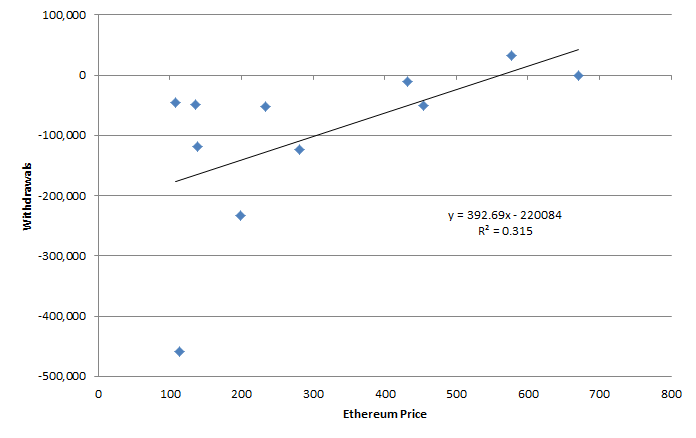
Figure 10 further validates the previous conclusion. As it can be seen from it, the analyzed ICO firms do not sell their holdings when the price of Ethereum is high, but instead made most of their withdrawals when the price was at its minimum. A good treasury management practice should do the opposite, i.e. sell only when the price is high.
This data shows that ICO firms are not adopting sound treasury management policies. They should as a consequence consider implementing a crypto hedging program, or delegating the management of their holdings to an investment professional.
The previous results highlight the following key takeaways: