Investors always prefer financial assets with high liquidity and reflective of the real trading conditions, with no wash trading or market manipulation. However, sometimes the public data may not be trustful, like in the case of crypto markets. In this research article, we analyzed historical volume data of a highly popular cryptocurrency exchange and evaluated to what extent the reported volume reflects the real one.
In our previous article 3 Major Benefits of Crypto Liquidity Provision on Price, Volume and Volatility, we analyzed the market liquidity from three different aspects and how investors could benefit from high liquid market. Similarly, exchanges with high liquidity would be more appealing to investors, which enable them to charge more for listing fees. That’s why some cryptocurrency platforms or tokens inflated their trading volumes. In this report, we analyzed the trading volume reported by an exchange.
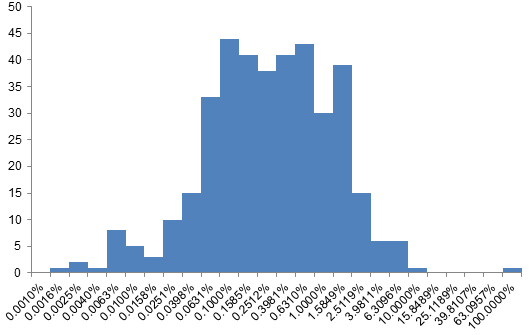
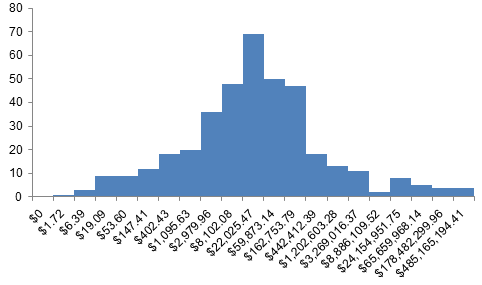
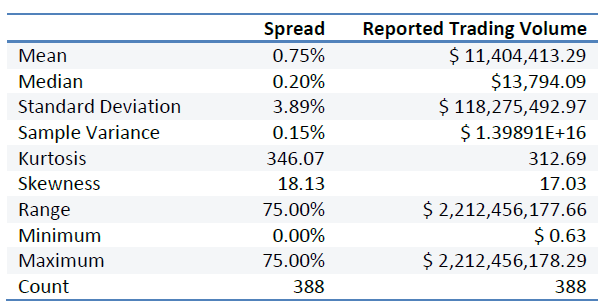
Figure 1 shows the reported trading volume of trading pairs listed on an exchange platform. After log transformation, the distribution of trading volume is close to a normal distribution, with a peak at 10, which is around $30,000. Figure 2 shows the distribution of spread, which is concentrated at the range -320% to -160%. Those are the data reported by exchanges. Table 1 summarizes some basic statistics of spread and the reported trading volumes of trading pairs we analyzed in this report. The average spread is 0.75% with a standard deviation of 3.89%. The small spread indicates high liquidity of the market and low trading costs. Unlike spread, trading volume is more spread, with volume from 0.63 to 2.2 billion. However, if we only use spread and trading volume as criterion of liquid markets, we would probably pick the wrong markets.
In the previous section we mentioned why some exchanges or tokens have incentives to fake their trading volume. In this section, we will analyze the truth under the veil. Before dive into the analysis, we need to understand how traders manipulate the trading volume through wash trading. Wash trading refers to a practice in which an investor places sell and buy orders on the same asset simultaneously in order to generate misleading information of a market such as a high liquidity or a high demand of the asset.
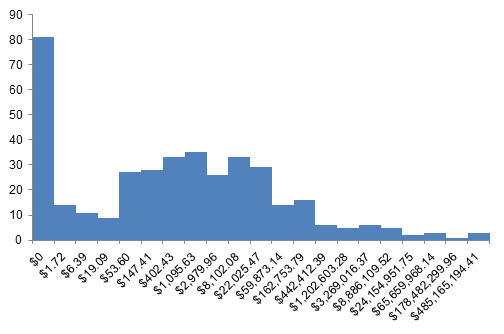
Figure 3 shows the distribution of real trading volume, which is completely different from the distribution of the reported trading volume showed in Figure 1. While the reported trading volume concentrated at range 8 to 13, the real trading volume peaked at range 0 to 1. Figure 4 shows the percentage of real trading volume in the reported trading volume. For most cases, only up to 5% of the trading volume reported is based on real trades.
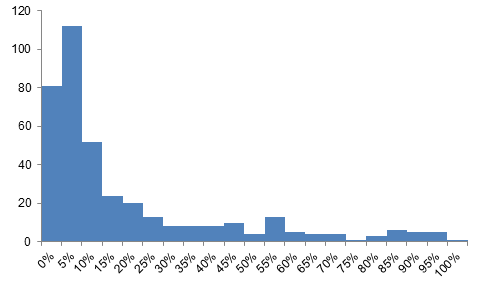
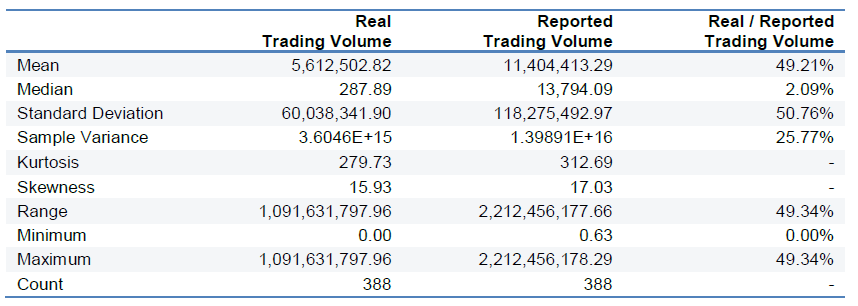
Table 2 shows the statistics of real trading volume and the reported trading volume. The huge difference between those two volumes could also be detected from their statistics. For example, the averages of the real and the reported trading volume are not even at the same magnitude.
Such difference also exists while analyzing trading pairs based on trading type. Figure 5 shows the spread vs. trading volume for different types of trades. Again, we could see that the real trading volume (in blue) has a smaller intercept than the intercept of the reported trading volume line (in red), indicating that real trading volume is much smaller than the trading volume reported by exchange platforms. Moreover, the real trading volume tends to be more sensitive to the spread than the total volume does, with a higher absolute value of slope.
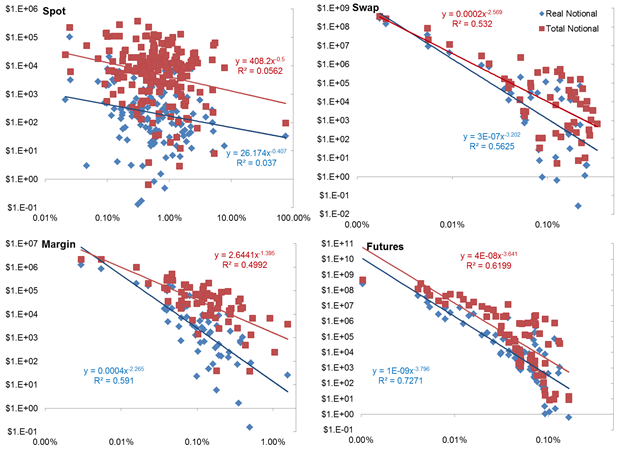
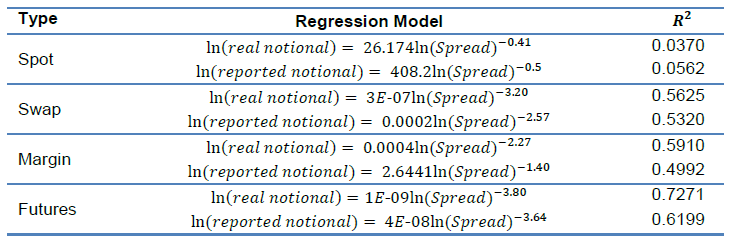
Table 3 shows the regression models of regressing spread on the real and the reported trading volumes. Except for spot, the regression models based on the real trading volume data have better performances than models based on the reported trading volume, with higher R square. For spot, the small sample size could be a reason for the R square being slightly lower than that of the model using the reported trading volume data. As the reported trading volume includes plenty of fake trades, we would expect a weak relationship between spread and the reported trading volume and that’s what the results we got as well.
The previous results highlight the following key insights: