By Andrea Leccese
January 1st, 2019
Executive Summary
This research paper analyses the performance of a systematic long/short investment strategy applied to a basket of top 14 cryptocurrencies by traded volume. In particular, it shows the superior performance of this strategy on both risk and returns compared to a passive buy-and-hold investment in Bitcoin or a crypto basket, which in contrast have large and long drawdowns. It also highlights that it is not advisable invest in crypto basket funds, since their performance is very similar to a passive investment in Bitcoin.
This research is structured as follows. The first section outlines the characteristics of cryptocurrencies from an investment point of view. The second and third sections analyze the performance of a passive investment in Bitcoin and crypto basket respectively. The fourth section compares the performance of a hypothetical systematic long/short crypto trading strategy compared to a passive investment in Bitcoin and in a crypto basket. The fifth section concludes with key takeaways.
Table of contents
- General Characteristics of Cryptocurrencies
- Performance buy-and-hold investment strategy in Bitcoin
- Performance buy-and-hold investment strategy in a basket of cryptocurrencies
- Performance systematic long/short crypto investment strategy
- Conclusion
1. General Characteristics of Cryptocurrencies
In this research we analyze the top 14 cryptocurrencies by traded notional reported in Table 1. The total notional traded each day on the exchange is around $200 million.
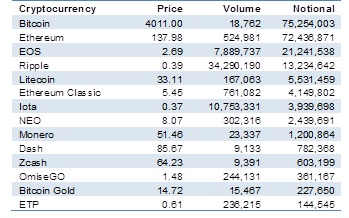
Figure 1 shows the percentage of traded notional by cryptocurrency as of December 2018. As it can be seen from it, Bitcoin and Ethereum constitute the majority of traded notional, with a combined total of 73.28%. This is mostly due to the fact that Bitcoin was the first introduced cryptocurrency, so it had a first-mover advantage, and the fact that ERC-20 tokens used in ICO’s are based on Ethereum.
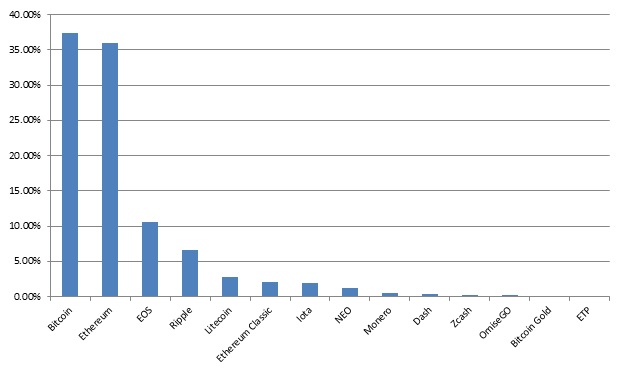
Figure 2 shows the closing price of these cryptocurrencies from March 2013 until December 2018. As it can be seen from it, cryptocurrencies experienced two major crises, one from 2013 to 2015, the other one from early 2018 until present. It also shows that cryptocurrencies are highly correlated, exhibiting similar price behavior.
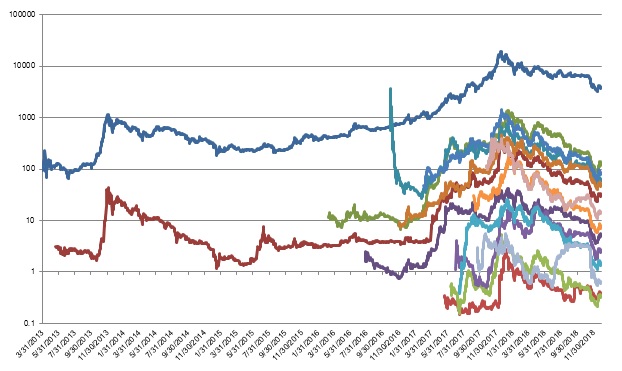
Figure 3 shows the traded volume on a log scale for the considered cryptocurrencies. As it can be seen from it, there has been a general uptrend in traded volume during 2017, coinciding with the high increase in price of the crypto basket, following by a decrease in both price and traded volume from January 2018.
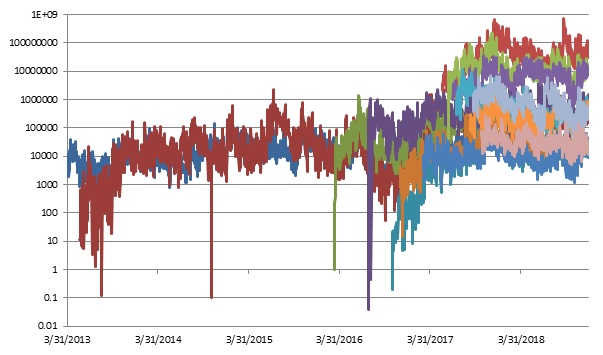
Figure 4 shows similar results regarding the traded notional on a log scale over time.
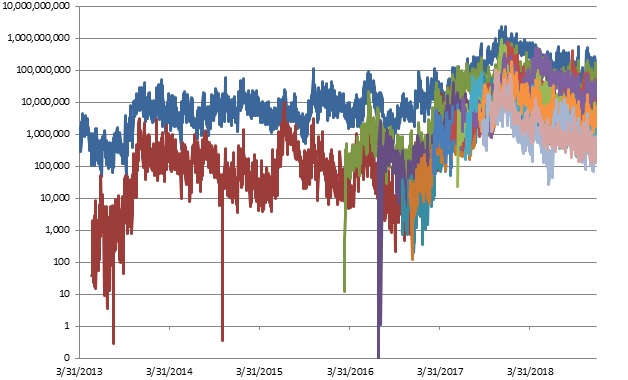
Figure 5 shows the contribution to the total notional traded over time. As it can be seen from it, while Bitcoin is still the most traded cryptocurrency, it lost most of it dominant market share during the past 5 years, going from almost 100% of cryptocurrency traded notional to around 37% today.
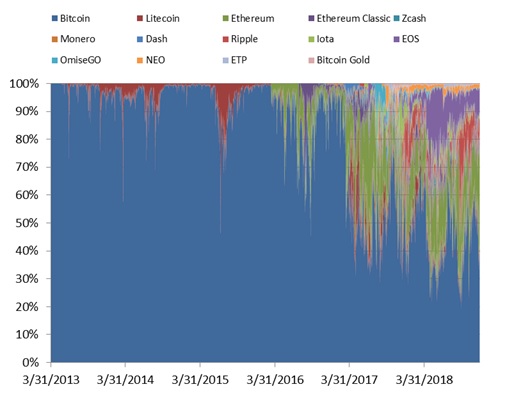
Figure 6 reports the rolling 60-day volatility for Bitcoin and the crypto basket.
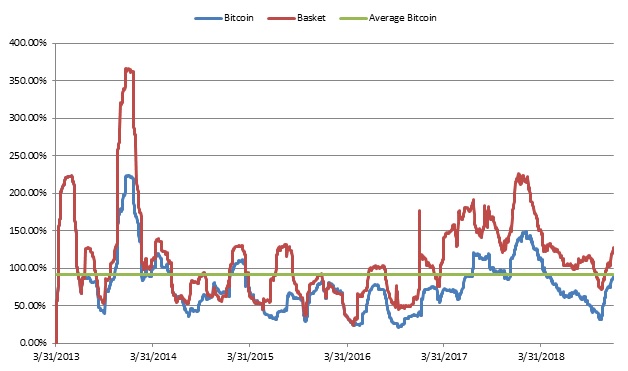
As it can be seen from it, crypto is a very volatile asset class, with an average Bitcoin volatility of 91.73% and an average volatility for the crypto basket of 114.13%. This is much higher compared to traditional asset classes like Equity and Fixed Income, and highlights 3 points:
- Potential to profit from volatility in cryptocurrencies: active investors who use strategies like systematic long/short can potentially profit from the volatility in cryptocurrencies.
- Need for an active volatility targeting approach: most investors who want to invest significant amount of capital in this asset class cannot tolerate an average annualized volatility of x% on a significant portion of their capital.
- Additional evidence why institutional investors have not invested in crypto yet:most of the trading in cryptocurrencies is driven by retail investors and not institutional ones until present, because of the many risks present in the asset class, among which too high market risk due to the exceptional levels of volatility present in this asset class, which is too large for most of all institutional investors who want to deploy a significant amount of capital.
2. Performance buy-and-hold investment strategy in Bitcoin
Figure 7 shows the price of Bitcoin from March 2013 until December 2018 on a log scale.
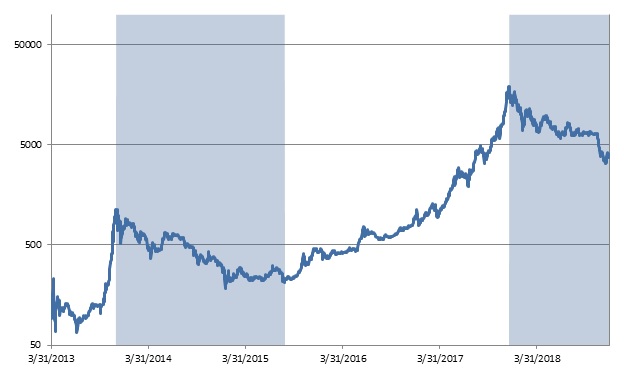
As it can be seen from it and from Table 2, Bitcoin experienced 2 major crises during the considered period. The first crisis went from 11/30/2013 to 8/26/2015, for a total length of 1.74 years, while the second one went from 12/17/2017 until present, for a length of 1.03 years.
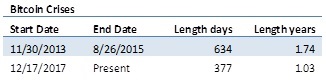
Figure 8 shows the drawdown for a buy and hold strategy in Bitcoin, while Table 3 shows its drawdown statistics.
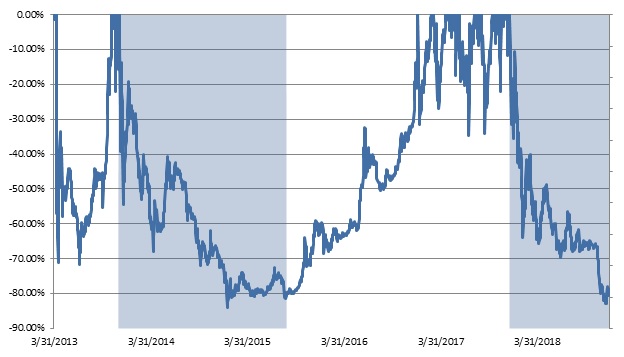
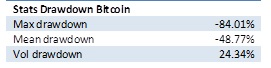
As it can be seen from them, a buy-and-hold investment in Bitcoin experienced significant drawdowns, with a max drawdown of 84.01% and a mean drawdown of 50%. This means that a long-term investors would have lost that most of its investment if entered at a time when Bitcoin peaked in price, such as January 2018, as many investors actually did because of the widespread publicity that Bitcoin had in that period.
Figure 9 shows the distribution of daily returns in Bitcoin.
Table 4 shows the performance statistics of a buy-and-hold investment in Bitcoin during the considered period.
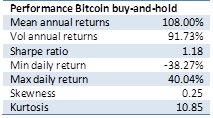
As it can be seen from it, Bitcoin potentially provides high returns, with a mean annual return of 108%, but at the same very high risk, In fact, the average annualized volatility is 91.73%, and daily returns can go from -38.27% to 40.04%. This is also evidenced by the high kurtosis of 10.85, which highlights the fat tail behavior of this asset. The Sharpe ratio, which shows the amount of return per unit of risk taken, is 1.18. This figure is quite good compared to traditional asset classes like equities, which historically have a Sharpe ratio around 0.4.
The previous data of a buy-and-hold investment performance in Bitcoin highlights the importance of having an active investment strategy capable of mitigating losses during market downturns or potentially profit from it by going short. Such a strategy will be analyzed in depth in section 4.
The previous data of a buy-and-hold investment performance in Bitcoin highlights the importance of having an active investment strategy capable of mitigating losses during market downturns or potentially profit from it by going short. Such a strategy will be analyzed in depth in section 4.
3. Performance buy-and-hold investment strategy in a basket of cryptocurrencies
Figure 10 shows the performance of a crypto basket equally invested in the top 14 cryptocurrencies by traded volume from March 2013 until December 2018 on a log scale.
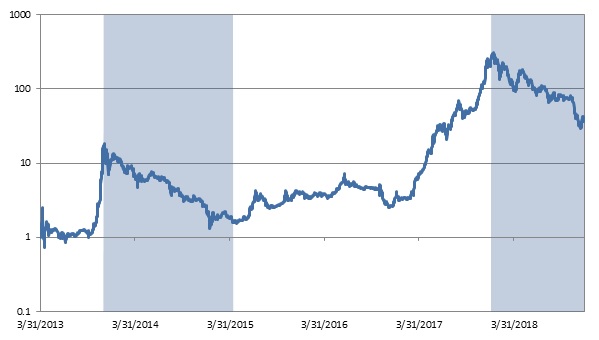
As it can be seen from it and from Table 5, the crypto basket experienced 2 major crises during the considered period, in a similar way to Bitcoin. The first crisis went from 11/30/2013 to 4/14/2015, for a total length of 1.37 years, while the second one went from 1/4/2018 until present, for a length of around 1 year.
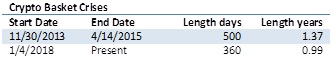
Figure 11 shows the drawdown for the crypto basket, while Table 6 shows its drawdown statistics.
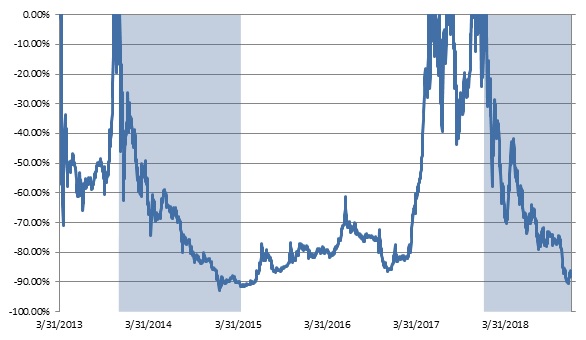
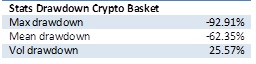
As it can be seen from them, a buy-and-hold investment in the crypto basket experienced even worst drawdowns than Bitcoin, with a max drawdown of 92.91% and a mean drawdown of 62.35%. This means that a long-term investors would have lost that most of its investment if entered at a time when the crypto basket peaked in price, such as January 2018, as many investors actually did because of the widespread publicity that Bitcoin had in that period.
Figure 12 shows the distribution of daily returns in the crypto basket.
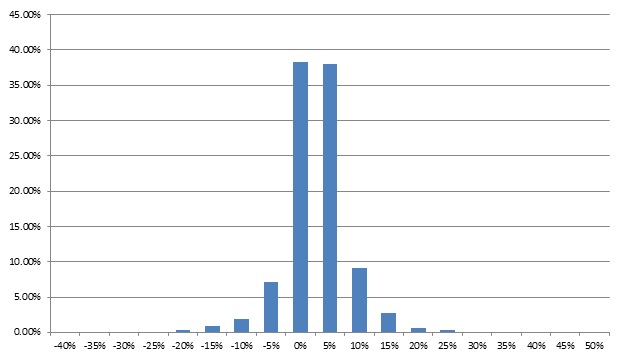
Table 7 shows the performance statistics of a buy-and-hold investment in Bitcoin during the considered period.
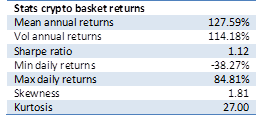
As it can be seen from it, similarly to Bitcoin the crypto basket potentially provides high returns, with a mean annual return of 127.59%, but at the same very high risk, In fact, the average annualized volatility is 114.18%, and daily returns can go from -38.27% to 84.81%. This is also evidenced by an exceptionally high kurtosis of 27, which highlights the fat tail behavior of this asset. The Sharpe ratio, which shows the amount of return per unit of risk taken, is 1.12, slightly less than a passive long-term investment in Bitcoin. This figure is quite good compared to traditional asset classes like equities, which historically have a Sharpe ratio around 0.4.
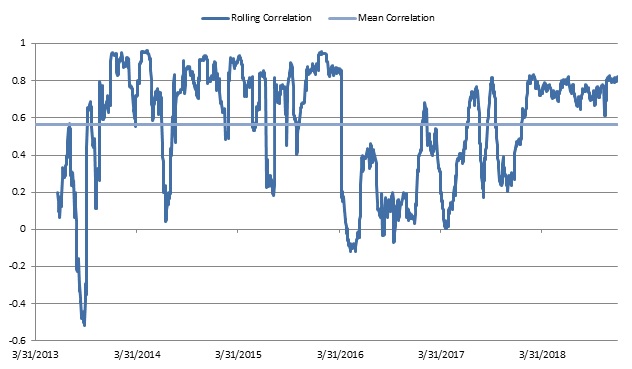
The previous data show that a passive buy-and-hold investment in a crypto basket is almost the same as a pure buy-and-hold investment in Bitcoin. It also highlights that it is quite useless to pay management and performance fees (typically 2-20) to one of the many basket crypto funds that emerged importance in the past year, which charge alpha for providing beta instead. As it can be seen in fact from the previous data, the performance of the crypto basket is almost the same as a passive Bitcoin investment, or even worst after taking transaction costs into account. It is interesting to see why the crypto basket performance and Bitcoin are very similar. Figure 13 shows the average correlation among the top 14 cryptocurrencies in the crypto basket. As it can be seen from it, the average correlation between the analyzed cryptocurrencies is 0.56, and most of the time is above 0.7. According to portfolio theory, an investor can receive benefits from portfolio diversification if the assets in the portfolio have low or negative correlation. As it can be seen from the data, it is not the case for cryptocurrencies, which makes the performance of the crypto basket very similar to a passive investment in Bitcoin.
The previous data show that a passive buy-and-hold investment in a crypto basket is almost the same as a pure buy-and-hold investment in Bitcoin. It also highlights that it is quite useless to pay management and performance fees (typically 2-20) to one of the many basket crypto funds that emerged importance in the past year, which charge alpha for providing beta instead. As it can be seen in fact from the previous data, the performance of the crypto basket is almost the same as a passive Bitcoin investment, or even worst after taking transaction costs into account. It is interesting to see why the crypto basket performance and Bitcoin are very similar. Figure 13 shows the average correlation among the top 14 cryptocurrencies in the crypto basket. As it can be seen from it, the average correlation between the analyzed cryptocurrencies is 0.56, and most of the time is above 0.7. According to portfolio theory, an investor can receive benefits from portfolio diversification if the assets in the portfolio have low or negative correlation. As it can be seen from the data, it is not the case for cryptocurrencies, which makes the performance of the crypto basket very similar to a passive investment in Bitcoin.
In addition to the results in a passive buy and hold investment in Bitcoin, this data highlights the importance of having an active investment strategy capable of mitigating losses during market downturns or potentially profit from it by going short. Such a strategy will be analyzed in depth in the next chapter.
4. Performance systematic long/short crypto investment strategy
Figure 14 shows the backtested performance net of transaction costs of a systematic long-short trading strategy applied to the top 14 cryptocurrencies by traded volume. The strategy is compared to a passive buy-and-hold investment in Bitcoin, and the performance of the crypto basket. The strategy volatility is set to have the same volatility as the crypto basket to facilitate the comparison. As it can be seen from the figure, the strategy achieves a much better performance compared to both Bitcoin and the crypto and consistent performance across both bull and bear markets.
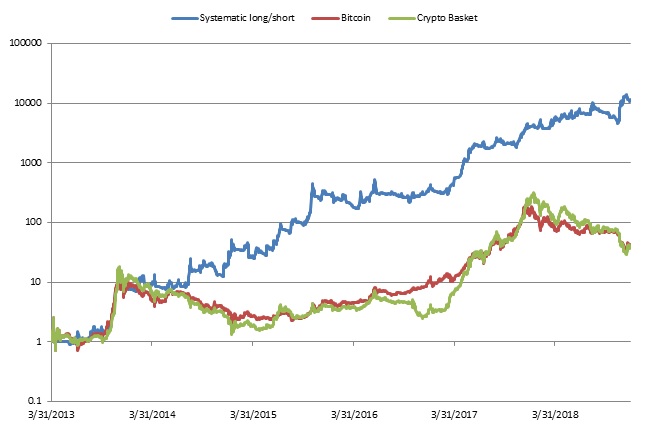
Figure 15 shows the drawdown for the systematic long/short trading strategy compared to Bitcoin and the crypto basket.
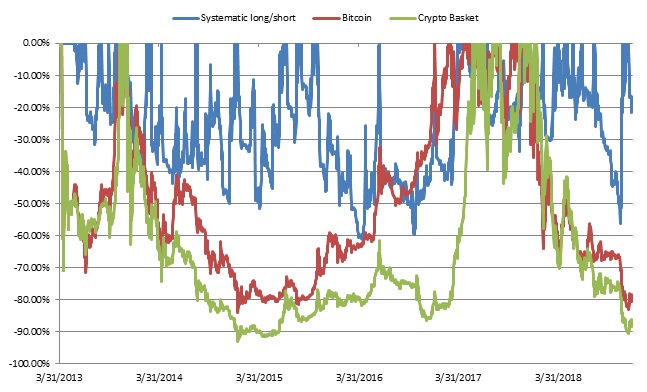
Table 8 shows the drawdown statistics for the 3 investment portfolios. As it can be seen from it and from Figure 15, the portfolio has much lower and faster to recover drawdowns. The max drawdown is in fact around 62%, compared to 84% for Bitcoin and 93% for the crypto basket. The mean drawdown is instead 24% for the portfolio, around half compared to Bitcoin and 60% less compared to the portfolio.
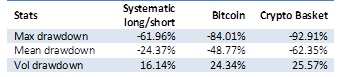
Table 9 shows the performance measures for the 3 strategies. As the table shows, the systematic long/short greatly outperforms both a passive Bitcoin investment and the crypto basket. On the return side, it achieves an annual average return of 224%, almost double both Bitcoin and the crypto basket. On the risk side, it has around the same amount of volatility of the crypto basket per construction, and slightly more volatility than Bitcoin. As a result of the better return delivered with around the same amount of risk, the strategy achieves a much better Sharpe ratio of 1.96, compared to 1.18 for Bitcoin and 1.12 for the crypto basket. As previously indicated, the max drawdown is also much less and faster to recover.
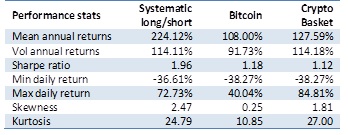
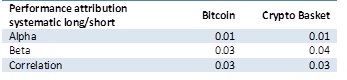
Table 10 shows the performance attribution stats for the systematic long/short strategy. As it can be seen from the results, the strategy delivers real alpha, with a positive value of 0.01 against both benchmarks. The strategy delivers no beta and is uncorrelated to both Bitcoin and the crypto basket. This result is what should be expected by hedge funds, who are active investors that should deliver performance, as measured by alpha, irrespective of their benchmark and market conditions, as measured by beta. On the contrary, most crypto funds charge alpha for beta. In fact, despite they being passive investors providing a simple inexpensive crypto basket, which has a high beta to Bitcoin, they charge the same fees that hedge funds require for delivering alpha based on extensive research.
In conclusion, based on the previous results, even after transaction costs the systematic long/short investment strategy proves to be superior compared to a passive long-term investment in Bitcoin or in a basket of cryptocurrencies.
5. Conclusion
The previous results highlight the following key takeaways:
- Crypto is a highly volatile asset class: the average Bitcoin volatility is around 91.73%. This creates both big risks, but also good opportunities for active professional investors able to adopt the right investment strategy.
- Passive buy-and-hold investment in Bitcoin delivers large and long drawdowns: holding Bitcoin passively for the long-term provides long and big drawdown. The max drawdown is in fact 84%, while the longest drawdown length was 1.74 years. This highlights the need for an active crypto investment strategy that can potentially profit in both bull and bear market conditions by going both long and short.
- Crypto baskets have very similar performance to a passive investment in Bitcoin:it is quite useless investing in a basket of cryptocurrencies, since they deliver similar performance to a passive buy-and-hold investment in Bitcoin only. This is due to the high correlation among cryptocurrencies (mean of 0.6), which provides almost no benefit in terms of portfolio diversification
- Systematic long/short crypto investment strategy provides uncorrelated performance across bull and bear market conditions: as shown by the performance stats, the systematic long/short crypto investment portfolio delivers almost double returns than Bitcoin and the crypto basket for the same amount of risk. In fact, over the period it achieves around 224% mean annual returns, compared to 108% of Bitcoin, with almost the same volatility, leading to an almost double Sharpe ratio. The drawdowns are also smaller in both size and duration, with a max drawdown of 62% compare to 49% in Bitcoin.
In conclusion, crypto is a very volatile asset class. This creates big risks, but also big opportunities for the right strategy. By allocating to an active long/short investment strategy an investor has good chances to reap the potential benefits offered by this asset class.
Subscribe to our newsletter to receive our latest insights in quantitative investment management. For more info about our investment products, send us an email at info@blueskycapitalmanagement.com or fill out our info request form.