By Andrea Leccese
November 6th, 2018
This research analyses the unfunded status problem in the US public pension system. Based on the results of this analysis, the unfunded status in the public pension fund system is a problem of national importance, that is going to impact negatively US taxpayers and public employees both in an economic and welfare manner if it is not solved promptly.
The analysis finds that 86% of the public pension funds in the United States are unfunded, with a mean funded ratio of 73%. This translates in a total amount of $1.32 trillion in unfunded liabilities, or about 7% of the total national US debt ($20.1 trillion). It also results from the analysis that pension funds currently have unrealistic expectations about their prospective returns, with the average fund forecasting 7.61% in expected future investment returns, while historical levels based on their current allocation suggest a more realistic achievable return of 6.93%, a difference of 0.70% translating in around $22 billion per year.
The current unfunded status of the US public pension system can be solved by using one or a combination of three solutions: collecting more taxes from taxpayers to fund the current annual required contribution (ARC); reducing the level of benefits disbursed to retirees; or shifting the current allocation of underperforming pension funds towards alternative investments, like quantitative hedge funds, which have a historical track record of providing superior risk-adjusted returns. Since the first two solutions have both adverse economic and welfare effects on private citizens and public sector employees, the best solution to be followed is shifting the current allocation of pension funds towards alternatives. For example, by increase the current average allocation to hedge funds from 18% to 38%, it is estimated that the pension funds would achieve an annual level of return on their assets of 9.51%, which would be enough to achieve parity in funding their current and future estimated liabilities without collecting taxes or reducing employee benefits.
The research is organized as follows. The first part introduces some general characteristics of the US public pension system. The second part analyses the current situation for public pension funds, exposing the unfunded status problem under the current asset allocation scheme. Finally, the third part concludes by showing a potential solution to this problem, consisting in shifting the current allocation of public pension funds towards alternative investments, in particular quantitative hedge funds. All the data on public pensions are sourced from the Center for Retirement Research at Boston College.
Table of Contents
General Characteristics of the US Public Pension System
In the US there are currently around 170 public pension funds administered at the state and local level. They currently have a total of $3.2 trillion of assets under management, and provide pension benefits to approximately 27 million public employees, including state and local employees, teachers, police officers, and fire fighters. Table 1 lists the top 20 pension funds by value of actuarial assets, along with their current membership and annual payroll paid.
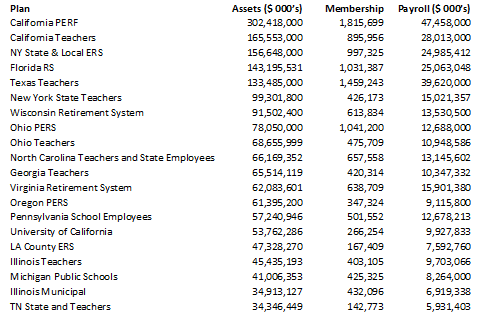
Table 1 Top 20 Public Pension Funds by Actuarial Assets
Analysis of the Current Funded Status
Funded Status
Figure 1 shows the distribution of current funded status of US public pension funds. It shows that the mean funded status is only 73.32%, resulting in an average shortage of 26.68%. This translates into a total unfunded status for the entire system of $1.16 trillion, which is around 6% of the total US public debt ($20.1 trillion), and an average unfunded status of around $7 billion for each pension fund. The figure also illustrates that some funds have a funded status below 20%, which will likely result in their bankruptcy if drastic remedies are not taken.
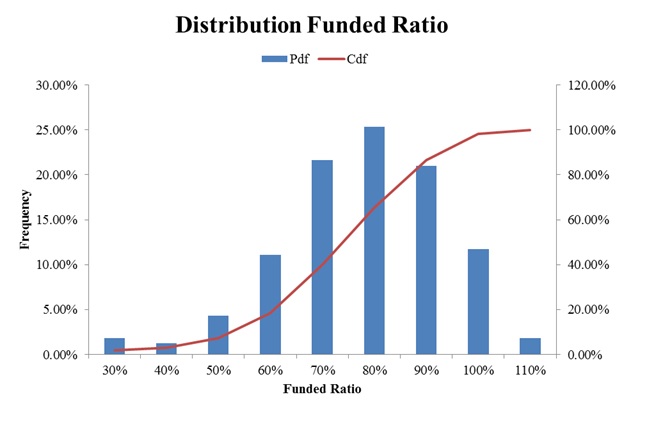
Figure 2 shows the current unfunded liability in notional terms for the top 20 states. It results from the data that only 2 states (Washington D.C. and South Dakota) out of 51 have fully funded liabilities, while some states like California and Illinois owe more than $150 billion in total liabilities. On average each state has $22.58 billion in unfunded liability outstanding.
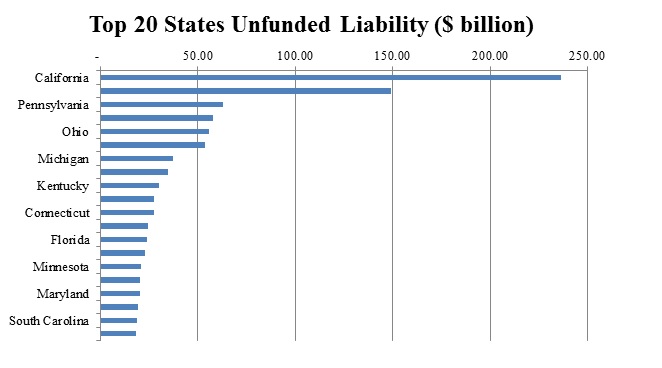
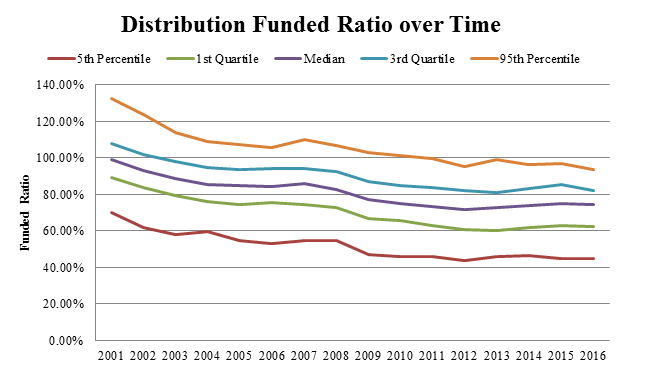
Figure 3 shows the distribution of the funding ratio over time, from 2001 until 2016. It can be seen from it that the funded ratio has constantly been deteriorating over the years, starting from a median funded ratio of 99% in 2001 to arrive to a median of 74% in 2016.
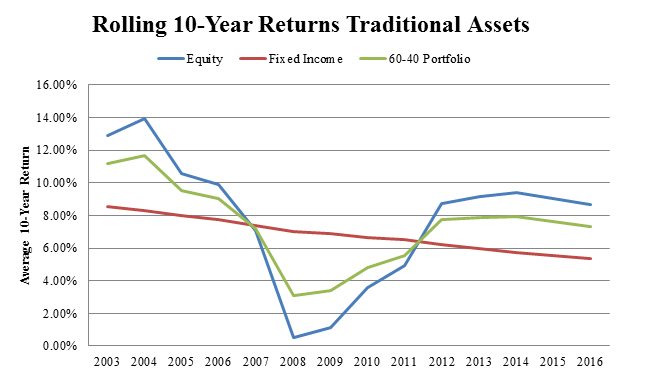
This worsening in the funded status is mainly due to a reduction in the average investment returns provided by equities and fixed income and the incapacity of public pensions to make the required contributions to keep a healthy funding status. As Figure 4 shows, both equity and fixed income returns have decreased during the early 2000’s, with equity sector returns going from 14% to 0.5% in 2008, with a partial recovery later at 8%, which is 6% below the initial level in 2001. The same holds true for the fixed income sector, with a steady decline in returns from 8.5% to 5% mainly due to the quantitative easing put in place by the Federal Reserve to recover from the financial crisis of 2008. The previous factors resulted in a decrease in public pension funds returns, which are heavily invested in traditional asset classes and in particular in 60-40 portfolios, which have achieved returns going from 10% in 2003 to 6% in 2016.
Current Asset Allocation
Figure 5 shows the distribution of the average asset allocation of the US public pension funds as of 2016. The data demonstrates that most of the assets are allocated to equities and fixed income securities, which comprise 71% of the total allocation. A smaller portion of 18% is allocated to alternatives, even if historically they have been an asset with higher performance, and the remainder 11% is distributed among real estate, cash, and other investments.
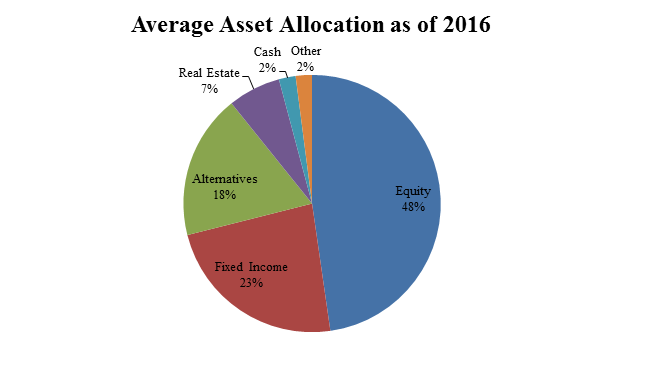
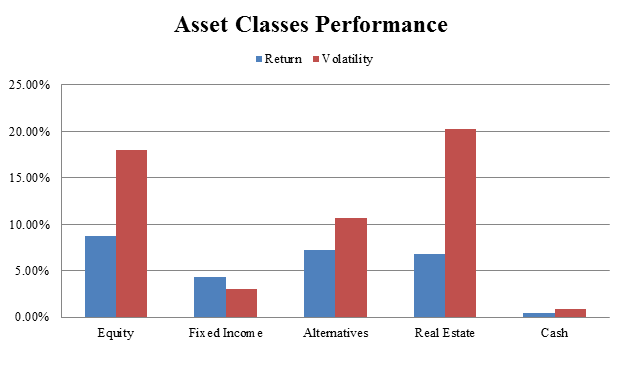
Figure 6 shows the average historical performance for the last 10 years for the asset classes to which pension funds allocate their capital. As it can be seen from the figure, pension funds should shift their allocation from equity towards alternatives and partially fixed income in order to achieve a greater return per unit of risk taken and better serve their liabilities.
Investment Return Assumptions
Figure 7 shows the distribution of the current investment return assumptions for the US public pension fund system.
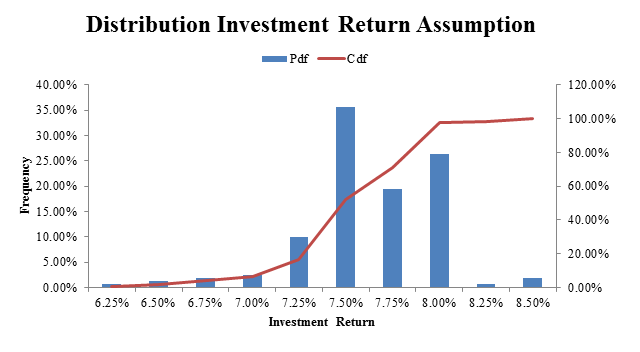
Figure 8 shows the average investment return assumption from 2001 until 2016. As it can be seen from it, most managers assume an annual investment return of 7.5%, with a min of 5.5% and a max of 8.5%
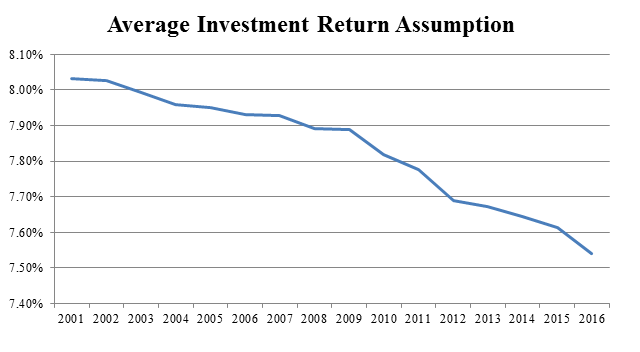
Figure 9 illustrates the difference between the assumed investment return and an estimated one using current asset allocation data and more realistic investment performance figures from the last 10 years for the asset classes in which pension funds are invested. As the data shows, pension funds overestimate on average their achievable investment returns with a statistical significance at the 10% level. The average overestimation is equal to 0.70% with a max of 3.32%. This data demonstrates that current return assumptions are unrealistic, and will likely need to be revised downwards in the next years if pension funds don’t change their current asset allocation scheme, resulting in an even greater liability.
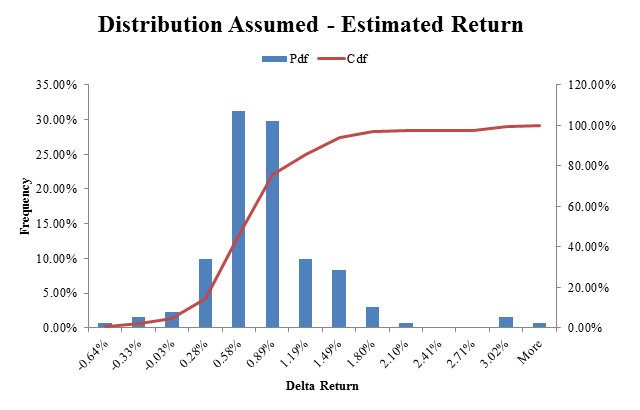
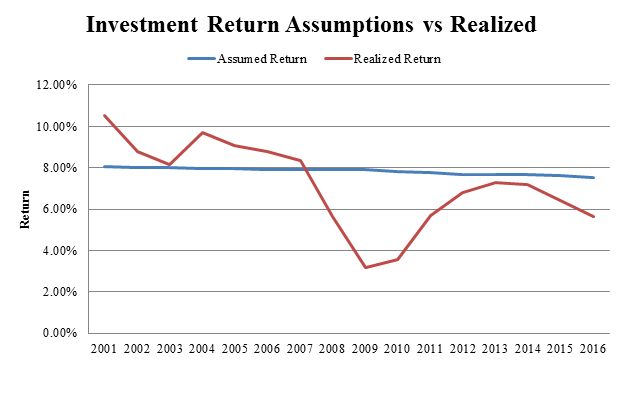
Figure 10 Assumed vs realized investment returns from 2001 to 2016provides another example of the overestimation in the current assumed investment return. As the figure shows, the assumed level of investment returns has consistently been above the return on assets realized by US public pension funds since 2008, with a current overestimation in 2016 at 2%.
By using more realistic investment return assumptions and keeping the current asset allocation constant, the average funded ratio will be 71.77%, or 1.11% less than the current one, with a minimum of 21.74% and a maximum of 108.24%.
Annual Required Contribution
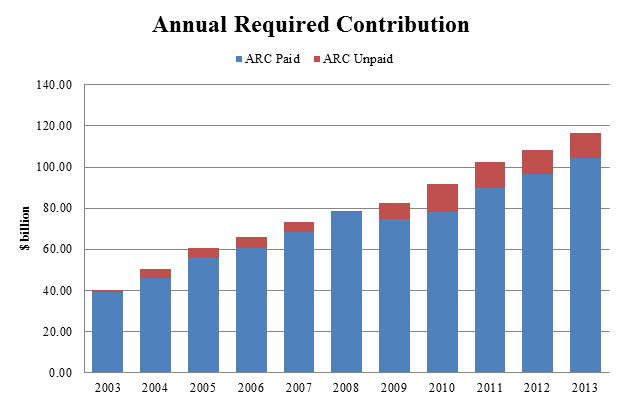
Figure 11 shows the annual required contribution over time, together with the percentage paid. As the figure shows, from 2003 to 2013 there has been a strong uptrend both in the total annual amount to be paid, and at the same time in the amount unpaid each year, going from almost 0 in 2003 to about 10% of the total in 2013. This is an important indicator since making timely payments each year to fund unfunded liabilities is a good indicator of the willingness of the plan sponsor to keep a healthy plan in the long term.
Analysis Potential Solution to the Funded Status Problem
Plan Assets vs Liabilities
Figure 12 shows the historical and projected total plan assets compared to their liabilities for the US public pension funds. The data shows that, by keeping the current asset allocation constant, the funded situation will get worse every year, with an unfunded status (difference in plan assets and liabilities) going from $1.32 trillion in 2016 to a projected $2.45 trillion in 2030.
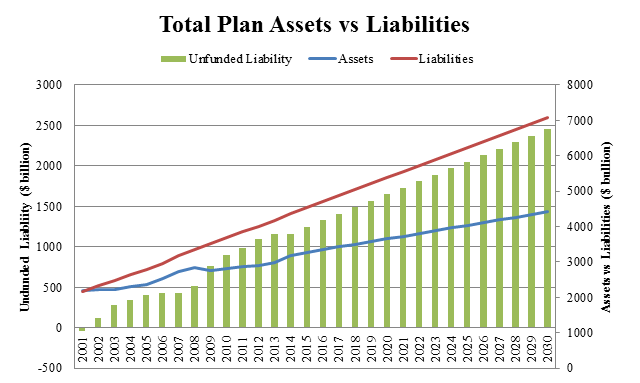
This deteriorating situation in the public pension fund status can be only reversed by using one or a combination of three solutions: collecting more taxes to pay for the increasing required contribution; reducing current and future employee and retiree benefits over time; or shifting the current allocation towards asset classes like hedge funds providing superior risk-adjusted returns. Since the first two solutions have negative economic, social, and welfare effects on US citizens, the third solution is the best since it simply requires a reallocation from traditional to alternatives, which provide higher risk-adjusted returns.
Allocation to Alternatives
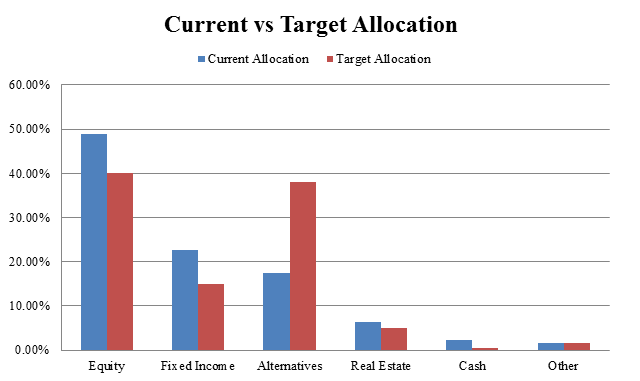
A potential solution to the public pension fund status problem consists in shifting the current asset allocation from equity and fixed income towards asset classes providing higher annual investment return, like quantitative hedge funds, which had a strong and consistent superior risk-adjusted performance in the last decade. Under the current asset allocation, pension funds are achieving a current return of 6.61% per year. They can achieve parity in the growth rate of assets and liabilities by reaching an additional 2.91% in asset returns per year. As a result, a target annual rate of return of 9.51% for the assets would stop the current increase in the unfunded liabilities.
Figure 13 shows a potential target allocation that would achieve and even surpass this result. By slightly reducing the current exposure to traditional asset classes and increasing the allocation to alternatives from 18% to 38% the pension funds can achieve an estimated annual rate of return for their assets of 9.95%, beating the target return of 9.51% by 0.43%.
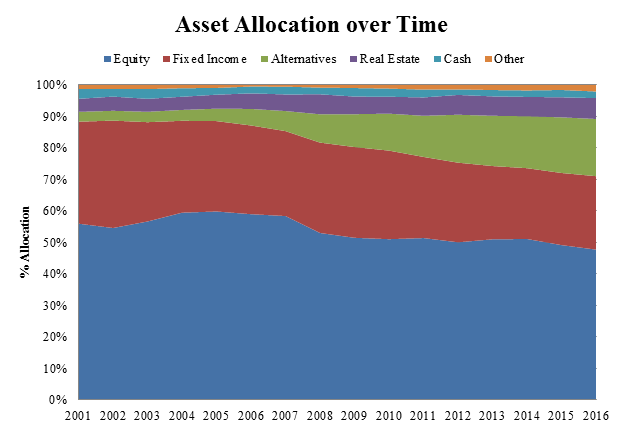
As Figure 14 shows, many pension funds have already started to follow this solution, going from an average level of 3% in 2001 to 18% in 2016, but many others are lagging behind and may still benefit from it. This solution would not only bring parity in the funded status, but would actually allow a reduction in the unfunded liability status without recurring to the other two expensive alternative solutions of increasing taxes or reducing benefits for the plan participants.
Conclusion
The current public pension fund status is a problem of national importance for the United States that needs to be addressed as soon as possible. With a current total liability of $1.32 trillion, or about 7% of the public US debt, projected to increase to $2.45 trillion by 2030 there will be serious problems for both all US taxpayers as a whole and to future retiree if drastic remedies are not taken. As the data in this report demonstrates, a simple and effective solution that can both stop and even reduce this increase in unfunded pension plan liabilities consists in shifting the current allocation from traditional assets towards alternatives, in particular quantitative hedge funds that thanks to their higher sophisticated research provide superior risk-adjusted returns to their clients. It is imperative that plan sponsors adopt this change in allocation towards alternatives promptly in order to avoid additional costs and further damage to the country before it will be too late to do so.
Subscribe to our newsletter to receive our latest insights in quantitative investment management. For more info about our investment products, send us an email at info@blueskycapitalmanagement.com or fill out our info request form.