By Alyssa Wei
June 28th, 2021
Bitcoin is a volatile asset. However, it also provides investors opportunities in reaping the excess returns associated with risks. This report analyzes the performance of Bitcoin and a Long-Short Portfolio investing in Bitcoin and other crypto currencies. The analysis shows that the Long-Short Portfolio performance, which is almost uncorrelated to Bitcoin, beats the Bitcoin performance, independent of its direction under both normal and volatile market conditions.
The paper is structured as follows. The first section analyzes the performance of Bitcoin and a Long-Short Portfolio from 2014 until present. The second section analyzes the relationship of Bitcoin performance and the Long-Short Portfolio performance, with a particular focus on volatility. The last section concludes with key takeaways.
Performance of Bitcoin and an Active Long-Short Portfolio
The study’s time frame is from January 2014 to June 2020, which captures significant pullbacks of Bitcoin in 2014 and in 2018, and in the recent market crisis caused by COVID-19.
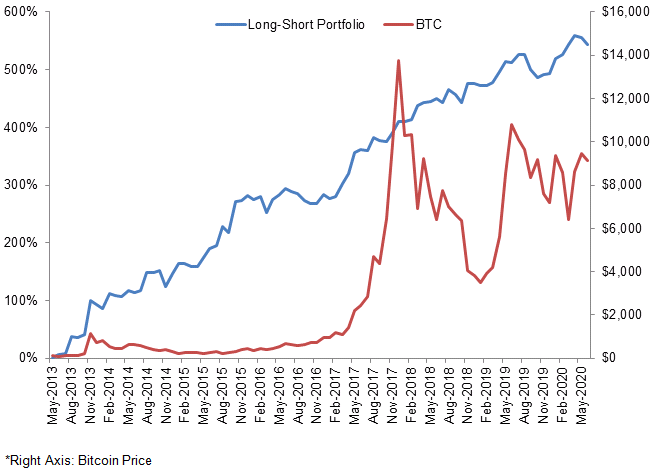
Figure 1 shows the price of Bitcoin and the return of a Long-Short Portfolio since January 2014. The price of Bitcoin has become very volatile since 2017. However the Long-Short Portfolio, which invests in crypto currencies, has a stable increasing return. Through portfolio diversification and the active investment strategy, the Long-Short Portfolio has a low correlation with Bitcoin, which is 0.15. The portfolio shows a strong resilience with respect to the volatility of Bitcoin.

The independent performance of the Long-Short Portfolio from the Bitcoin performance is also evidenced by the nearly zero slope of the linear regression line. The positive intercept indicates that the portfolio expects to have a positive return (alpha) even when the Bitcoin generates no return at all. The previous statistics highlight what should be expected from a high-quality active investment strategy. In other words, positive (alpha greater than 0) returns is independent of market direction (beta close to 0).
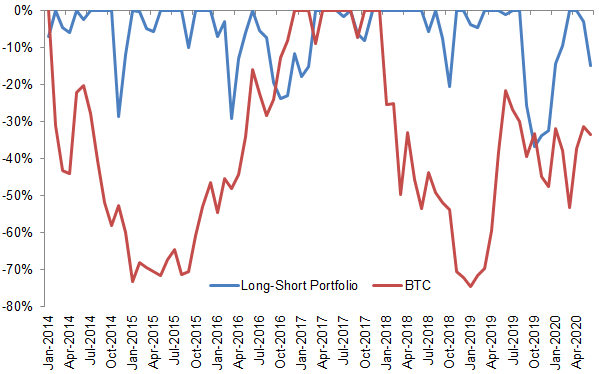
Figure 2 shows the drawdowns of Bitcoin and of the Long-Short Portfolio. As the portfolio targets a constant volatility level of 40%, Bitcoin is more volatile than the portfolio, with a max drawdown 74.55%.Bitcoin experienced two significant pullback periods: one from January 2014 to January 2015, and another from December 2017 to January 2019. Figure 3 shows the value of $1 investment in Bitcoin and the Long-Short Portfolio. Except for the end of 2017, the year during which Bitcoin price skyrocketed, Bitcoin underperformed the Long-Short Portfolio during the whole time frame of our study (Figure 3).
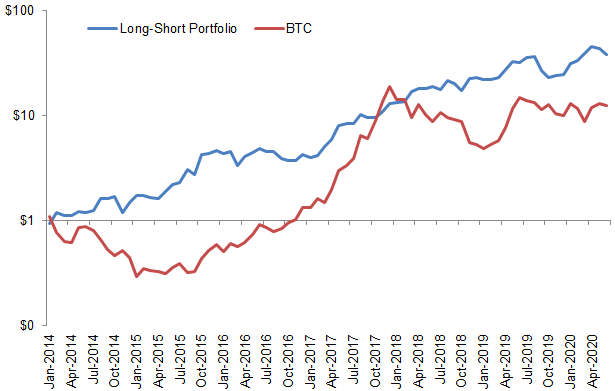
Table 2 shows the performance statistics of a Long-Short Portfolio and Bitcoin during the study’s time period.
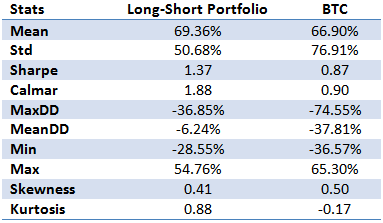
As the table shows, the Long-Short Portfolio outperforms Bitcoin, with a higher annual return 69.36% and a lower annual volatility 50.68%. The Sharpe ratio of the Long-Short Portfolio is 1.37, compared to 0.87 for Bitcoin. The portfolio also achieves a better Calmar ratio than Bitcoin does. The max drawdown of the portfolio is much smaller than that of Bitcoin. In summary, the Long-Short Portfolio provides a high risk-adjusted return compared to Bitcoin.
Characteristics of Bitcoin and the Long-Short Portfolio
In the previous section, we analyzed the performance of Bitcoin and the Long-Short Portfolio from 2014 until June 2020. Figure 4 shows the relationship between Bitcoin returns against the Long-Short Portfolio returns. As it can be seen from the fitted polynomial model, a quadratic relationship provides the best fit in this case. This means that the actively managed portfolio benefits more than proportionally from periods of high Bitcoin volatility, independent of market direction. This highlights that the portfolio can gain substantial profit in periods of market rallies, and especially crashes where many long-only investors lose money. Additionally, the regression formula has a positive intercept, indicating the positive return of the long-short investment strategy.
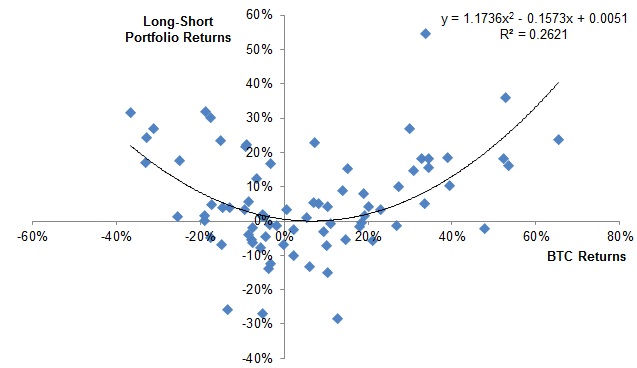
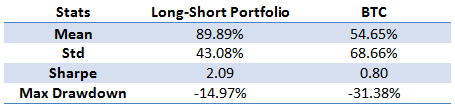
The most recent decline in Bitcoin’s price happened in the first quarter of 2020, during which the COVID-19 began to hit every corner of the world. As it can be seen from the data, the Long-Short Portfolio beats Bitcoin during the pandemic period as well, having one of the best periods historically. This is due to the highly volatile environment, as it should be expected based on the previous analyses. The Sharpe ratio of the portfolio in this period is 2.09, which more than double the Bitcoin’s sharpe. Therefore, we can conclude that an actively managed Long-Short Portfolio provides investors a great protection and profit from market crises and other highly volatile periods where most people lose money.
Conclusion
The previous results highlight the following key insights:
- Bitcoin has a high investment return but bears a high volatility as well: during our study’s time frame, the average Bitcoin return is 66.90% and the average volatility is around 77%. The high return of Bitcoin indicates its potential in adding great value to an investor’s portfolio. However, an appropriate strategy should be taken to manage the volatility introduced by Bitcoin.
- An active Long-Short Portfolio provides protection and high risk-adjusted returns, especially in period of high market volatility: as we saw in chapter 2, an actively managed portfolio thrives in periods of high volatility, thanks to its quadratic relationship with respect to Bitcoin returns. In particular, the active Long-Short Portfolio provided great returns during the recent Coronavirus crisis: while many people lost money during the recent covid-19 crisis, the actively managed portfolio returned 89.89%, while Bitcoin returned 54.65%. This translates into a high Sharpe ratio of 2.09 and a low drawdown of 14.97%, compared to 0.80 and 31.38% for Bitcoin.
Subscribe to our newsletter to receive our latest insights in quantitative investment management. For more info about our investment products, send us an email at info@blueskycapitalmanagement.com or fill out our info request form.