By Andrea Leccese
April 14th, 2019
Many companies in 2017 and 2018 decided to raise capital through an ICO by issuing tokens in exchange of cryptocurrencies like Bitcoin or Ethereum. We find that, while these firms managed to raise billions of dollars in this period, they didn’t manage their crypto holdings price risk, losing on average around 80% of the entire amount raised with the ICO. As a consequence, existing and new ICO companies should start adopting a proper ICO treasury management and crypto hedging program. This will allow them to minimize the risk of losing the capital raised during the ICO, because of the high volatility present in cryptocurrencies (~100% annualized volatility), and to meet their expenses in fiat.
This research paper is structured as follows. The first section gives an overview of the ICO market, with corresponding raised amounts. The second analyzes the volatility in cryptocurrency prices, Bitcoin and Ethereum in particular as they are the major cryptocurrencies accepted by ICO companies. The third section examines the ICO treasury management practices of a sample of ICO firms, showing their inability in managing their reserves properly. The fourth section concludes with key takeaways.
ICO Market Stats
During the period between September 2015 and March 2019, ICO’s companies raised a total of around $24 billion, with an average of $15.5 million per ICO. Table 1 shows the top 20 ICO’s by amount of capital raised.
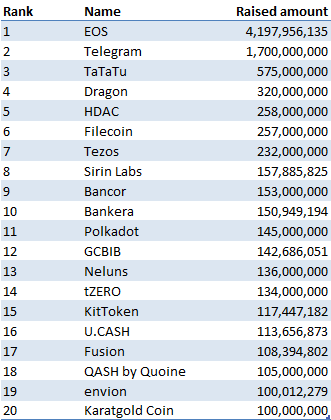
Figure 1 shows the top 20 countries where those ICO’s companies are domiciled. It is interesting to note that despite tighter security laws and scrutiny from the SEC, the United States comes first, followed by Singapore and the UK.
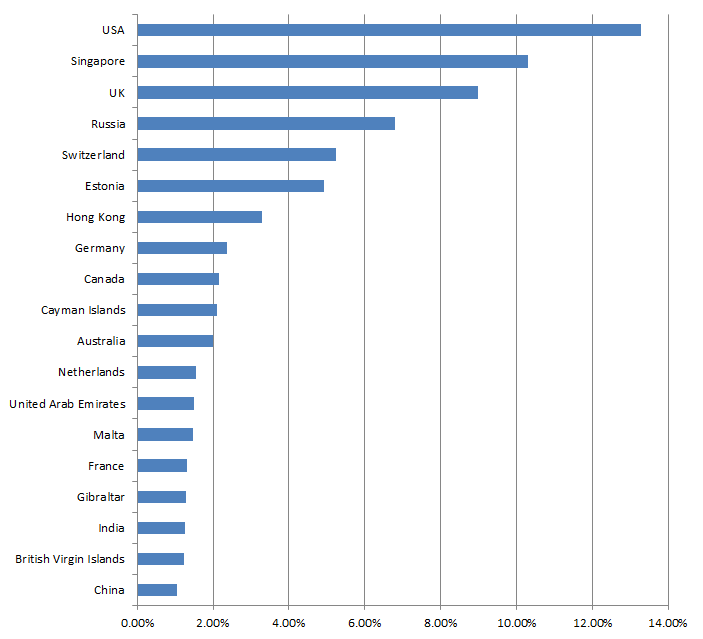
Figure 2 shows the category distribution of the analyzed ICO’s projects. Platform ICO’s come first, followed by cryptocurrency, business services and investments.
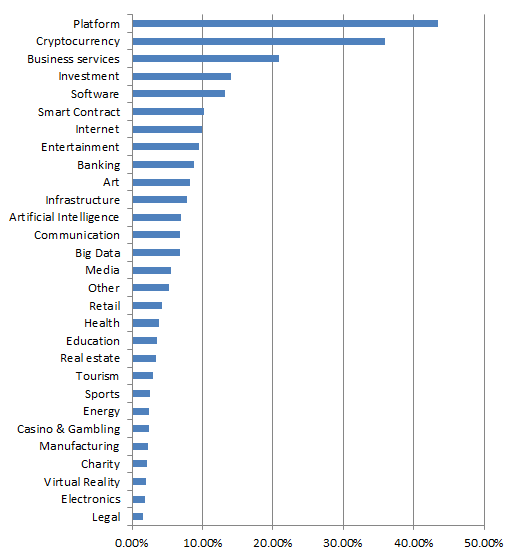
Table 2 shows the top 10 platforms used by the ICO projects to issue their tokens. As it shows, Ethereum is the major one with the ERC20 tokens, constituting around 90% of the tokens issued.
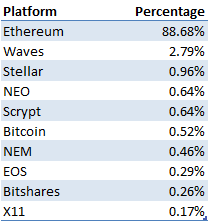
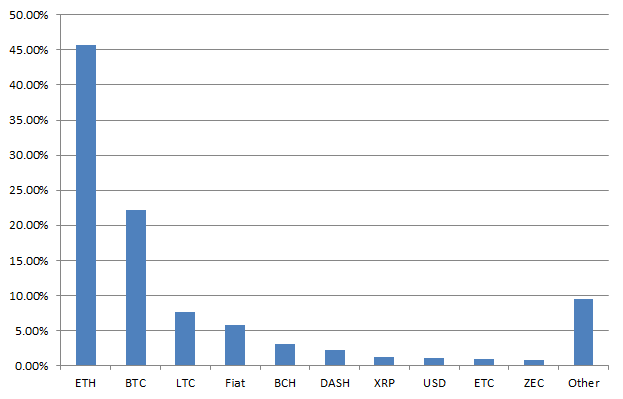
Figure 3 shows the distribution of accepted cryptocurrencies from ICO firms for their capital raising process. As it can be seen from it, the most accepted cryptocurrency is Ethereum, constituting around 45% of all analyzed projects, followed by Bitcoin at 22%. As a consequence, in this article we will focus on the price risk of Ethereum balances.
Analysis Ethereum Price Risk
Figure 4 shows the price of Ethereum from September 2016 until March 2019. As it can be seen from it, cryptocurrencies, in this case Ethereum, are very volatile. The price went in fact from around $12 at the start of the considered period, to a maximum of $1400 in December 2018, and back again to around $140 as of March 2019.
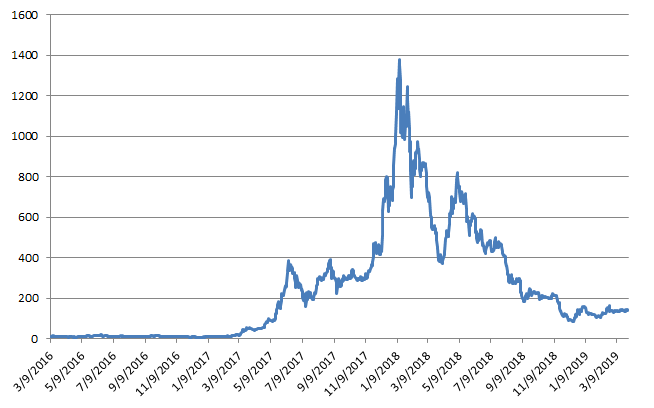
Figure 5 shows the rolling 60-day volatility of Ethereum. As it can be seen from it, Ethereum is very volatile, with an average annualized volatility of around 112% for the considered period.
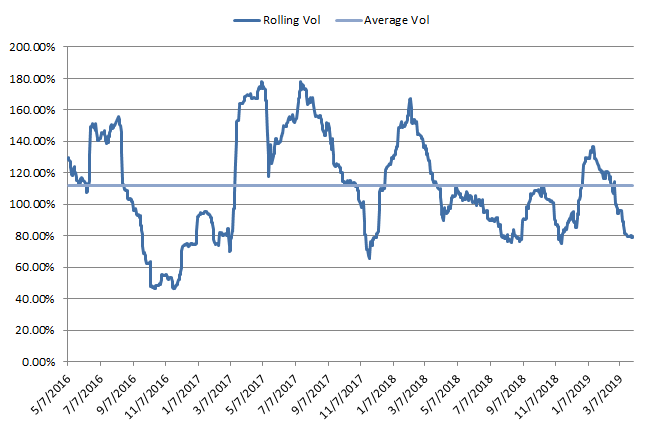
Figure 6 shows the drawdown for a buy and hold strategy in Ethereum. As it can be seen from it, a buy-and-hold investment in Ethereum experienced significant drawdowns, with a max drawdown of 94% and a mean drawdown of 45%. This means that an ICO company who would have raised capital at the Ethereum price peak in December 2018 and who did not liquidate its position, would have lost almost the entire fiat value of their holdings. This would have probably determined the failure of the project, since it would have not been able to meet its expenses in fiat like USD or EUR.
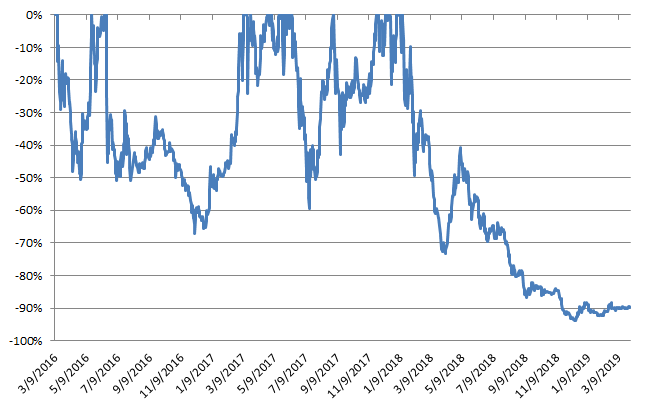
Table 3 shows the performance statistics of a buy-and-hold investment in Ethereum during the considered period.
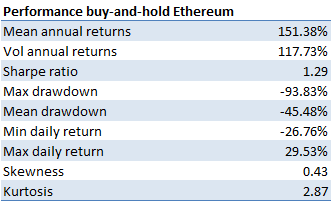
As it can be seen from it, Ethereum potentially provides high returns, with a mean annual return of 151%, but at the same very high risk, In fact, the average annualized volatility is 118%, and a max drawdown of 94%.
The previous data shows the importance for holders of cryptocurrencies like ICO companies to have a proper crypto risk management program in place to avoid losing the majority of their holdings values in fiat terms. An example of treasury management program would be a pure passive hedging program, where crypto holders lock-in their initial value of crypto holdings in fiat term. Another more dynamic approach would be an active hedging program, where they decide at which levels they want to hedge their crypto exposure. A last option would be a systematic crypto hedging program, where an algorithm analyzes the crypto data to determine when a bear market is more likely, and decides automatically on the best periods to hedge. The last two approaches would possibly provide both upside potential, and limit on downside losses.
In the next section we analyze the treasury balances of a group of ICO companies and see if they managed to implement a proper crypto risk and treasury management program.
Analysis ICO Treasury Management
In this section we analyze the treasury management reserves and behavior for a sample of around 50 ICO companies which have raised capital with Ethereum. Figure 7 shows the treasury balances for these companies in amounts of Ethereum. As it can be seen from it, many ICO firms still have a lot of their holdings in crypto, exposing them to a large crypto price risk and potential losses in fiat terms.
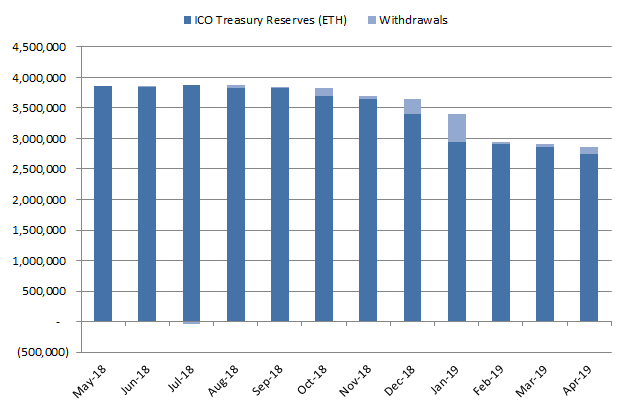
Figure 8 shows the USD value of crypto holdings for the considered ICO companies. As the figure shows, these firms lost the majority of their value in fiat terms, going from around $2.6 to about $400 million.
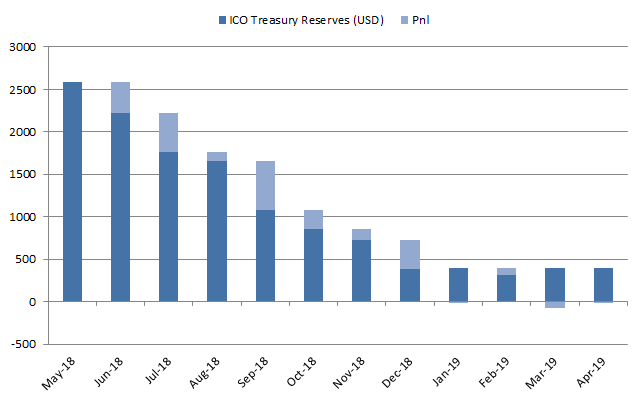
Table 4 shows the amount lost by these ICO companies because of change in Ethereum price, excluding the effect of withdrawals. As it indicates, the average ICO company lost around 73% of the value of their crypto holdings due to a improper treasury management practices. This poses into question the ability of these projects in being able to pay their ongoing and future expenses without raising additional capital.
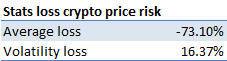
Figure 9 provides an additional piece of evidence in the lack of proper treasury management practices by ICO companies. As the figure shows, there is an inverse correlation (β = -1068.8) between change in Ethereum price and crypto holdings liquidated from treasury reserves. This is the opposite behavior that should be expected by good risk management practices. They in fact do not sell before Ethereum experiences losses, sitting on unrealized losses and hoping for a possible price increase in the future.
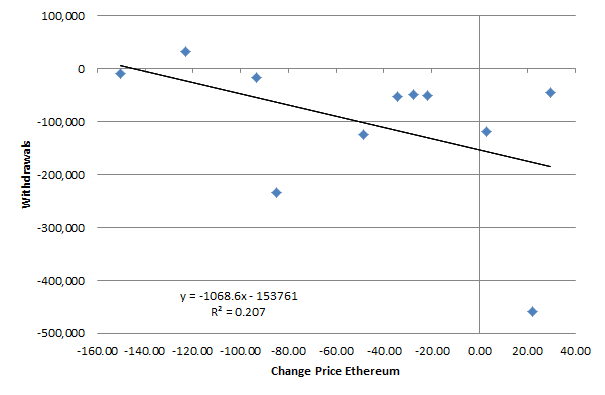
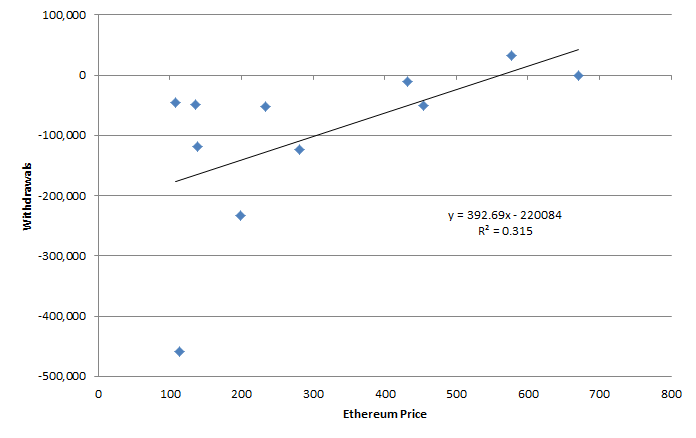
Figure 10 further validates the previous conclusion. As it can be seen from it, the analyzed ICO firms do not sell their holdings when the price of Ethereum is high, but instead made most of their withdrawals when the price was at its minimum. A good treasury management practice should do the opposite, i.e. sell only when the price is high.
This data shows that ICO firms are not adopting sound treasury management policies. They should as a consequence consider implementing a crypto hedging program, or delegating the management of their holdings to an investment professional.
Conclusion
The previous results highlight the following key takeaways:
- Cryptocurrencies, in particular Ethereum, are very volatile: while ICO’s present a promising way to raise capital through cryptocurrencies like Ethereum, they are also characterized by extreme price risk. The average annualized volatility of around 110% poses in fact a significant amount of risk if not hedged or managed properly.
- ICO companies have inadequate treasury management policies: the ICO’s analyzed in this article lost an average of 73% in their crypto holdings due to a change in the price of Ethereum. In addition, they liquidated most of their reserves at times when the price of Ethereum is at historical lows, showing their incapability in maximizing the value of their crypto holdings in fiat terms.
- ICO companies should consider adopting a crypto hedging program or delegating the management of their treasury reserves to an investment manager: in order to reduce their crypto price risk, ICO companies should consider adopting a passive or active hedging program capable of offsetting the gains and losses in their crypto holdings. Since they usually do not have internally the resources and competence to do so, they should think about outsourcing this process to an investment management company experienced in the field.
Subscribe to our newsletter to receive our latest insights in quantitative investment management. For more info about our investment products, send us an email at info@blueskycapitalmanagement.com or fill out our info request form.