By Alyssa Wei
June 28th, 2021
This research article analyzes the performance of different portfolios in the past two years from July 2018 to July 2020 and particularly during the coronavirus pandemic. We found that multiple-asset portfolios outperform non-diversified portfolios, especially the ones focus on equities. The high risk-adjusted and robust returns of such portfolios would benefit investors in the long term and protect their capital in periods of volatile markets.
The article is structured as follows. The first section analyzes the performance of financial assets in the past two years, with a special focus on the Covid period. The second section compares the performance of four common portfolios investing in multiple asset classes, including equity, fixed income, commodity, gold and currency. The last section concludes with key takeaways.
Performance of Financial Assets During the Past Two Years
On the last day of 2019, China reported a cluster of cases of pneumonia. About three months later, WHO declared the coronavirus outbreak a pandemic. Today, countries around the world are still under different degrees of lockdown. Associated with the COVID-19 pandemic is a world-wide turbulence across financial markets, including equities, fixed income and commodity markets. The impact of pandemic on financial assets brings up a big challenge to investors in portfolio management. Before we dive into the analysis of portfolio performances, let us take a look at the performance of financial assets. Table 1 shows financial assets included in our report.
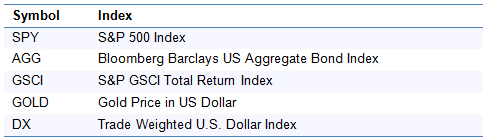
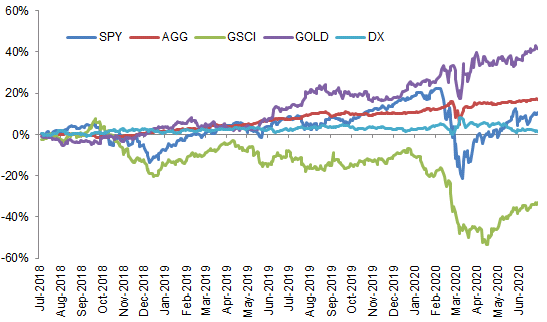
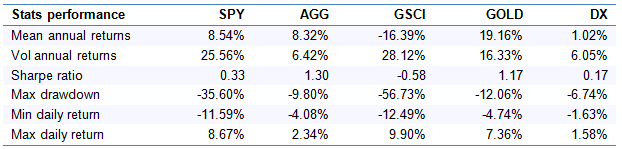
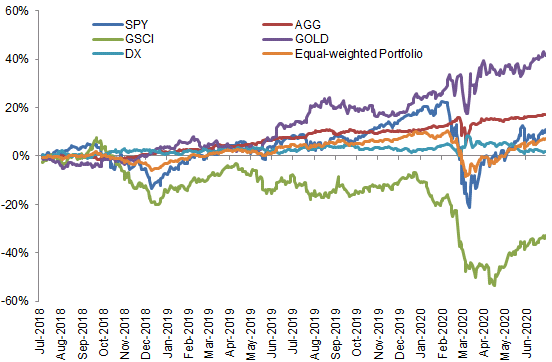
Figure 1 shows the cumulative returns of financial assets from July 2018 until July 10th 2020, including equity, fixed income, commodity, gold and currency (dollar). Indexes slide precipitously in February and March as coronavirus spreads to the world. Risky assets such as SPY and GSCI have max drawdown at 35.60% and 56.73% (Table 2).
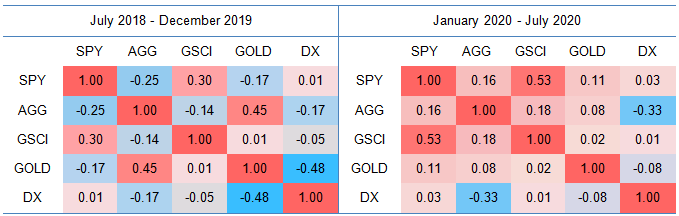
Asset correlations describe the movements of asset returns in relation to one another. An ideal portfolio would be constituted by unrelated or lowly related assets. However, correlations are not static. From Table 3, we noticed that some assets become more related. For example, the correlation between SPY and GSCI increased from 0.30 (during July 2018 through December 2019) to 0.53 (during January 2020 to July 2020). More importantly, some correlations change from negative (in blue) to positive (in red), such as the correlation between SPY and AGG. The dramatic changes of correlations may not be long-lasting. But if more and more financial asset pairs with negative correlations become positive, it would be difficult for investors to diversify their portfolio risk exposures.
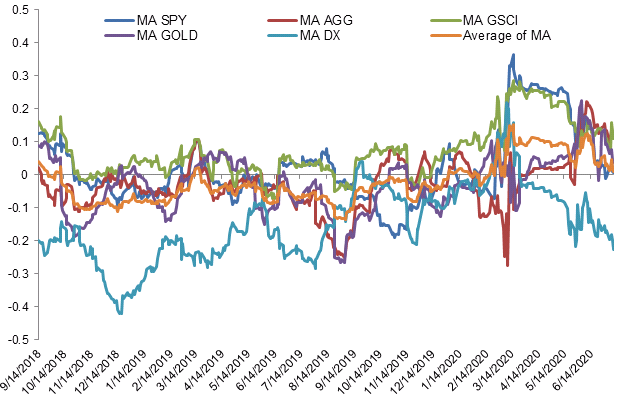
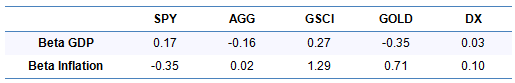
We also observe an increase of average correlations across financial assets in February and March (Figure 2). Again, the increase of average correlation between a financial asset and the other assets makes a portfolio more vulnerable to market shocks. In our report Impact of Macroeconomic Factors on Financial Assets and Portfolios, we found that SPY and GSCI are more sensitive to GDP than other assets do, with positive betas and high R^2 in the regression analysis. The correlations between SPY and GSCI increased during the volatile period, dominating the average correlations of them with other financial assets. That’s one of the reasons that we observe the increase in average correlations of SPY and GSCI in February and March. Table 4 shows the regression analysis results based on data from 1976 to 2015 (for details of the regression analysis: Impact of Macroeconomic Factors on Financial Assets and Portfolios). Returns of SPY and GSCI are positively related to GDP, while the AGG and GOLD are negatively related to GDP. The betas of inflation are also various across financial assets, indicating that AGG and GOLD could be used to diversify a portfolio’s risk exposures to risky assets and to hedge the portfolio from macroeconomic risks.
Portfolio Performance
As we see a market-wide decrease of asset return and correlation increase during market crisis, we would like to identify which portfolio is more resilient to market shocks. In this section, we compare the performance of four portfolios with different strategies, which are 60/40 portfolio, equal-weighted portfolio, minimum variance portfolio and risk parity portfolio.
60/40 Portfolio
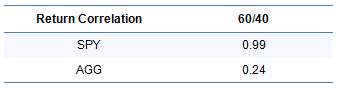
The traditional 60/40 portfolio invests 60% to equity (SPY) and 40% to fixed income (AGG). The 60/40 would be the benchmark in our portfolio analysis. Similar to what we have observed in the previous section, a 60/40 portfolio would suffer a huge loss in February and March. Moreover, the portfolio performance is highly correlated to the equity performance, which is represented by SPY (Figure 3). The high correlation between portfolio performance and SPY indicates a high risk exposure to equity market. Even though the portfolio only invests 60% to equity, the risk exposure to equity is much higher than 60%. The correlation of SPY and 60/40 portfolio even hits 1 over the study’s time frame (Table 5). This outlines the importance for investors to shift away from a traditional 60/40 portfolio as it doesn’t provide enough protection in volatile markets. A possible solution would be for example using a risk-parity portfolio or allocating more to bonds compared to equities since they have lower risk and offer protection in periods of market turbulence.

Equally-Weighted Portfolio
The equally-weighted portfolio weights every asset in a portfolio equally, meaning that we would allocate 20% investments to SPY, AGG, GSCI, GOLD and DX. Figure 4 shows the portfolio performance. As this portfolio invests into 5 financial assets, it would be considered more diversified than traditional 60/40 portfolio, and it would be more resilient to market crisis. The maximum drawdown of equal-weighted portfolio is 17%, while the maximum drawdown of 60/40 portfolio is 23.11%. However, the equal-weighted portfolio has the same downside as the 60/40 portfolio does –- high equity risk. In addition, it also exposes to commodity risk.
Minimum Variance Portfolio
The minimum variance portfolio targets on lowering the volatility of portfolio return. We build the minimum variance portfolio in a way that the portfolio could achieve the expected return of a traditional 60/40 portfolio while minimizing the portfolio volatility. Since nearly 70% of the portfolio allocates to fixed income (AGG) and Gold, the portfolio return is highly related to the performance of AGG and Gold (Figure 5).
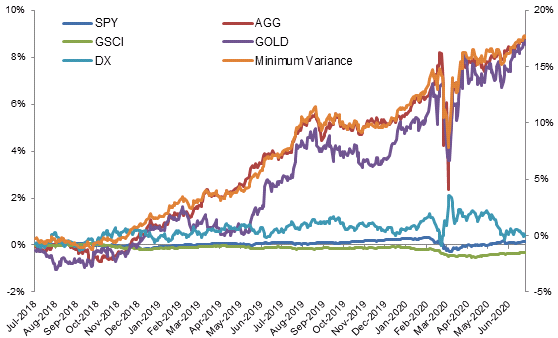
Figure 5 Weighted Cumulative Return of Financial Assets and Minimum Variance Portfolio (Jul 2018 – Jul 2020)
Risk Parity Portfolio
The risk parity portfolio focuses on risk allocation among financial assets. We construct the risk parity portfolio with every financial asset has equal risk contribution to the portfolio risk. Compared to minimum variance portfolio, risk parity portfolio invests evenly among financial assets, which could be observed in Figure 6. As minimum variance portfolio invests more in AGG and Gold, we could barely observe the weighted cumulative return of SPY and GSCI in Figure 5.
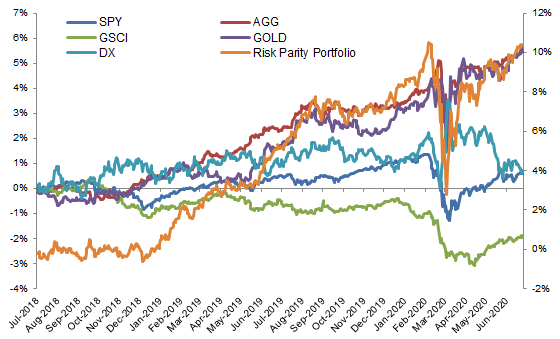
Figure 6 Weighted Cumulative Return of Financial Assets and Risk Parity Portfolio (Jul 2018 – Jul 2020)
Portfolio Performance Comparison
Table 6 shows the correlations between portfolio returns and financial asset returns. On one side, the correlation value reflects the risk exposure of a portfolio. For example, the 60/40 portfolio return is highly related SPY performance. The equal-weighted portfolio has more risk exposures to SPY and GSCI even though the allocation is equal among financial assets. On the other side, the correlations also reflect the asset allocation of a portfolio. For example, since the minimum variance portfolio invests more into AGG and Gold than the risk parity portfolio does, its performance is more correlated with those two financial assets.
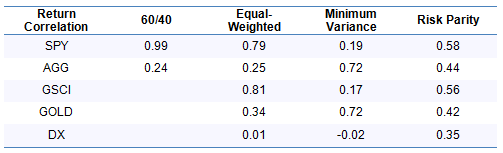
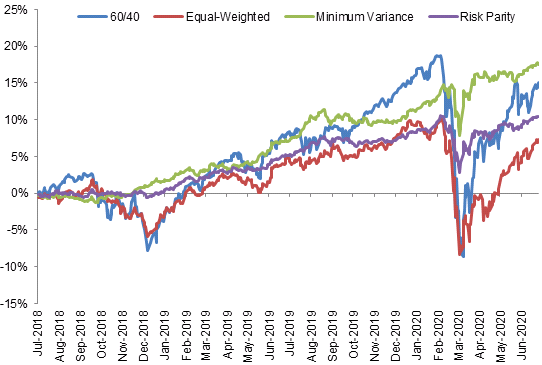
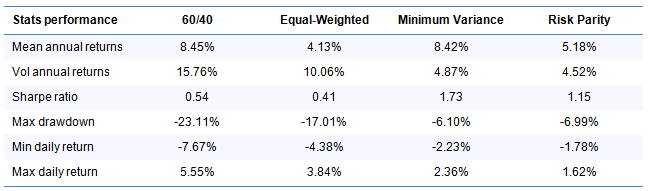
Figure 7 shows the performance of all four portfolios from July 2018 to July 2020. Before the market turbulence in February 2020, the traditional 60/40 has the highest cumulative return. It also suffers a substantial decrease of return compared to the other portfolios. However, benefiting from asset diversification, minimum variance portfolio and risk parity portfolio have a better performance during market crisis with Sharpe ratio at 1.73 and 1.15 respectively, which are more than double the return per unit of risk taken of 60/40 portfolio (Table 7). The resilience of a diversified portfolio also could be detected from the drawdowns, which is shown in Figure 8. The minimum variance portfolio achieves a return approximate to the return of the 60/40 portfolio with much lower volatility.
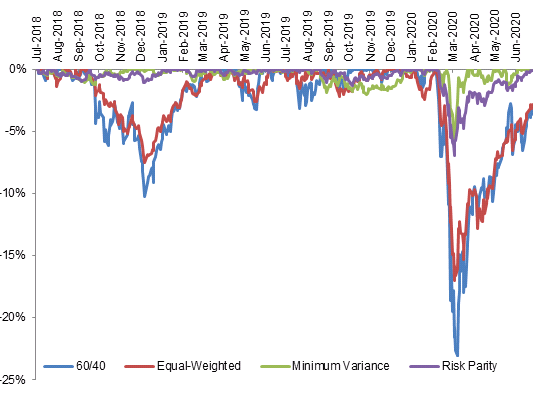
Table 7 shows the performance statistics of the 4 investment portfolios. As the minimum variance portfolio has the lowest weight assigned to SPY and GSCI, which suffer the most during this pandemic, the minimum variance portfolio has the lowest drawdowns, followed by the risk parity portfolio. However, we need to keep in mind that the diversification of financial assets is different from risk diversification. For example, the equal-weighted portfolio doesn’t show an advantage in terms of portfolio volatility or in Sharpe ratio during the study’s time period. The turbulence of both equity and commodity markets contributes to the poor performance of equal-weighted portfolio.
Conclusion
The previous results highlight the following key takeaways:
- Correlation among financial assets is not stable and it tends to increase during market crisis: the global financial market become more volatile since economic activities began to pause across the world because of the pandemic. Financial assets become more dependent to each. The dramatic changes of correlations would bring more pressure on portfolios that exposes to one single market or limited financial asset classes.
- Diversified portfolios are more resilient to volatile markets, with low volatility and drawdowns compared to traditional 60/40 portfolios: in our report Impact of Macroeconomic Factors on Financial Assets and Portfolios, we found that diversified portfolios have better risk-adjusted performance than the traditional 60/40 portfolio across different macroeconomic cycles. During the backtesting period from 1976 to 2015, the Sharpe ratio is 0.86 for 60/40 portfolio, 1.38 for minimum variance portfolio and 1.23 for risk parity portfolio. The resilience of such portfolios to market volatility becomes more outstanding during market crisis. The Sharpe ratio of the minimum variance and risk parity portfolios are 1.73 and 1.15 respectively, compared to 0.54 of the 60/40 portfolio.
About the Authors
Andrea is President and Portfolio Manager at Bluesky Capital. Prior to founding Bluesky Capital, Andrea worked as a Quant at Sauma Capital, a quantitative hedge fund in New York, and as a management consultant at Ernst & Young. Andrea holds an M.S. in Financial Engineering from Columbia University, and an M.S. in Industrial Engineering from the University of Rome “La Sapienza”.
Alyssa is a quantitative researcher at Bluesky Capital. She previously worked at leading wealth management and financial companies in the US and China. She is currently completing her master’s degree in Statistics at Baruch College, and holds a M.A. in Economics and Education from Columbia University and a B.A. in Accounting.
Subscribe to our newsletter to receive our latest insights in quantitative investment management. For more info about our investment products, send us an email at info@blueskycapitalmanagement.com or fill out our info request form.